


Bitcoin Range Continues, Litecoin Flat
FXOpen
The range in BTC/USD continued during the past week. This wasn’t much of a surprise considering that the period included the Christmas and New Year Holidays. Litecoin is trading little changed, currently quoted at $257 from $263 dollars last week.
Bitcoin Range Continues
After ending the rally on December 22nd bitcoin remained in a range. The top of this range is at $19,850 all-time high while the low is at the latest major swing low of $10,680. A break beyond either of these price extremes could usher in the new trend. For now we remain in ‘wait and see’ mode.
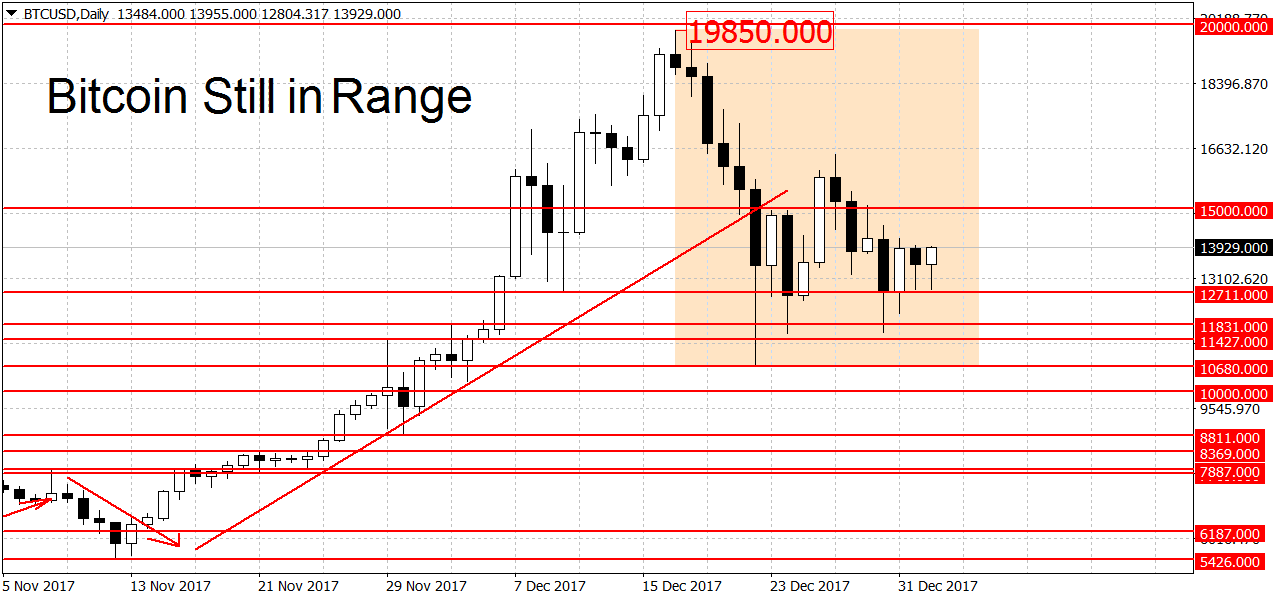
On the upside, we have weak resistance at the $15,000 round figure, followed by the latest swing high at $16,470 dollars. Higher still we have two weaker levels at the former swing highs of $17,147 and $17,547 dollars. A major resistance area can be found near the all-time high at $19,850 extending to the $20,000 round figure. A decisive breakout above this important milestone should lead to a new bullish trend on the daily chart.
Support on the way down can be found at $12,711 followed by $11,591 dollars. As noted above the $10,680 swing low is a potential downtrend starter. Further down we have the $10,000 round figure, which may act as support to falling prices. On the longer-term weekly and monthly charts, BTC remains in an uptrend.
Yesterday’s Gemini auction had a volume of only 0.07 BTC, signalling that most of the market checked out for the holidays. As market participants slowly return from the festivities we should see a pick up of volume and hopefully some directional moves.
Litecoin Trading Flat
Litecoin is trading mostly flat as well. It’s currently quoted at $257 dollars, down from $263 dollars during our last update. This is a drop of 2.2 percent, a negligible amount for a crypto-currency.
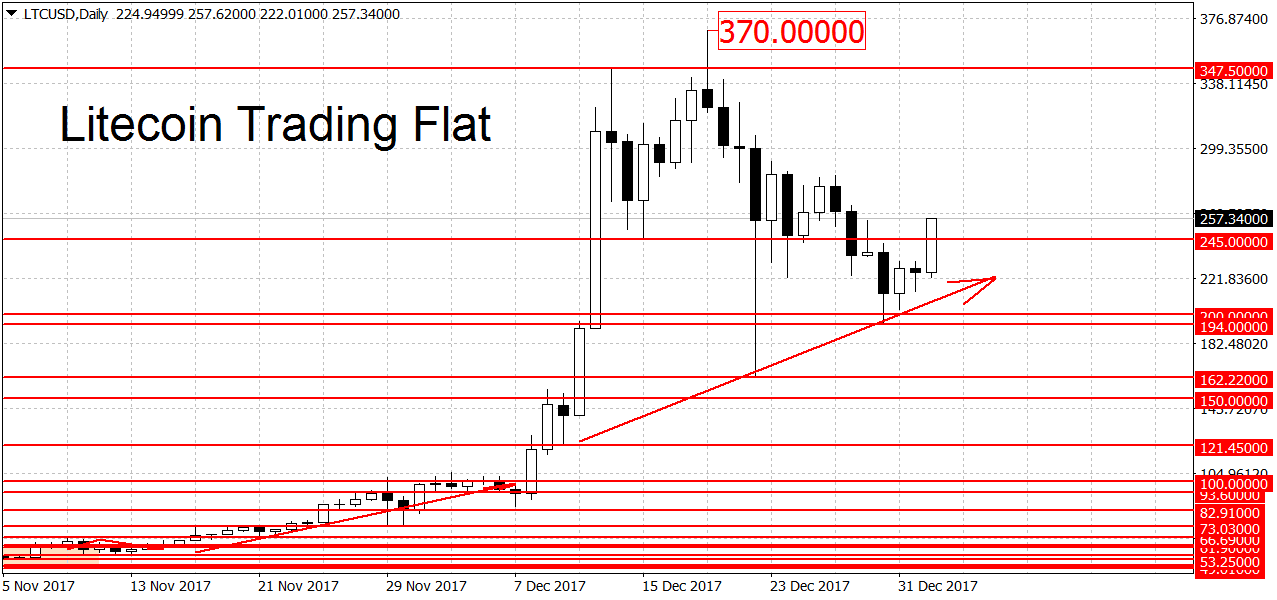
Unlike bitcoin, LTC/USD remains in an uptrend on the daily. To end it the bears will have to push prices below the latest swing low at $194 dollars. Slightly above here we have more support at the $200 round figure and the $245 level.
Resistance can be found at the $300 round figure, followed by the $347.50 swing high and $350 dollars. Naturally the all-time high at $370 dollars is another potential resistance. A breakout above it may accelerate the gains. Similarly to BTC, on the longer-term weekly and monthly charts LTC is looking bullish.
FXOpen offers the world's most popular cryptocurrency CFDs*, including Bitcoin and Ethereum. Floating spreads, 1:2 leverage — at your service (additional fees may apply). Open your trading account now or learn more about crypto CFD trading with FXOpen.
*Important: At FXOpen UK, Cryptocurrency trading via CFDs is only available to our Professional clients. They are not available for trading by Retail clients. To find out more information about how this may affect you, please get in touch with our team.
This article represents the opinion of the Companies operating under the FXOpen brand only. It is not to be construed as an offer, solicitation, or recommendation with respect to products and services provided by the Companies operating under the FXOpen brand, nor is it to be considered financial advice.
Stay ahead of the market!
Subscribe now to our mailing list and receive the latest market news and insights delivered directly to your inbox.


Latest articles

US Dollar Strengthens Amid Equity Market Weakness and Hawkish Fed Rhetoric
The US dollar continues to hold firm near multi-year highs as sentiment across equity markets deteriorates and investors increasingly expect the Federal Reserve to maintain a restrictive monetary policy stance for longer. The US economy remains resilient, while inflation risks

Bitcoin: Corrective Channel Broken as Traders Turn More Active
Bitcoin has come under the influence of several factors simultaneously. The wave of selling at the beginning of June was linked to Strategy's first disclosed Bitcoin sale in several years, a prolonged series of outflows from spot ETFs, and a

DAX 40: consolidation amid technology sell-off
A wave of selling in the technology sector that emerged earlier this week has weighed on European equities. The trigger was investor concern over the profitability of large-scale debt-funded investments by major US tech companies in AI infrastructure. The Nasdaq