


Bitcoin Retraces, Altcoins Still Unable to Rally
FXOpen
Since our last update, bitcoin had a healthy retracement of $25 dollars after its bounce at $300 dollars. This led us to a low of $274 per coin, a down move of over 8 percent. While altcoins have failed to keep up with the BTC/USD rally, they had no problem following big brother lower. Peercoin went down by 7%, Namecoin by 9% and Litecoin by 6 percent during bitcoin’s retracement. Most coins have retraced some of the those losses however, with both Bitcoin and Litecoin getting close to its previous highs.
Bitcoin Nears $300 Again
After a sizable 8 percent retracement, bitcoin is getting close to the $300 figure again. We are currently quoted at $288 dollars per coin, just 4 percent away from this important round number. As the daily chart below shows, $300 has held up 3 previous rallies. The BTC move up on January 7th stopped at $301.01. The rally on January 26th ended at $303.30, while the most recent bounce last week stopped at $298.999.
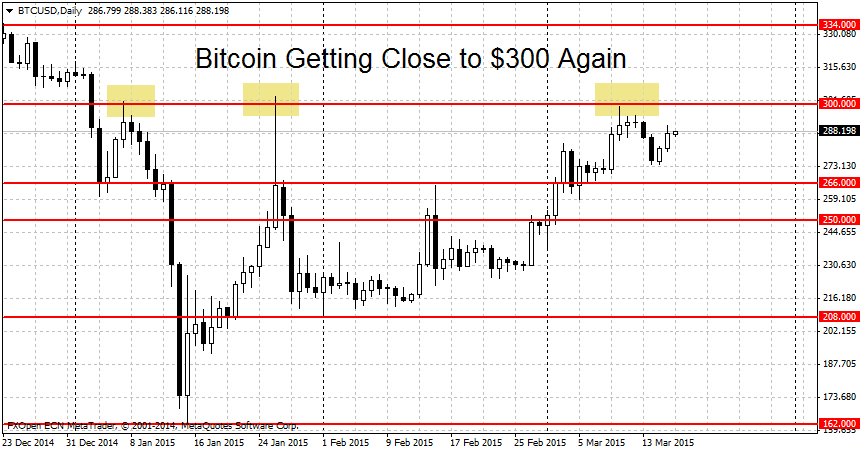
With each subsequent test of this level, the odds increase that we will see a breakout higher. If that happens, we may see a move up towards the previous swing high at $334 per coin. Higher up, notable resistance levels include $350 and $370. To end the current rally, the bears will need to take prices below $266.
Litecoin Yet to Break $2.05
Alternative cryptocurrency Litecoin has yet to clear the $2 dollars resistance figure and break its previous high at $2.05. The crypto may be waiting for bitcoin to take out $300 dollars before following along.
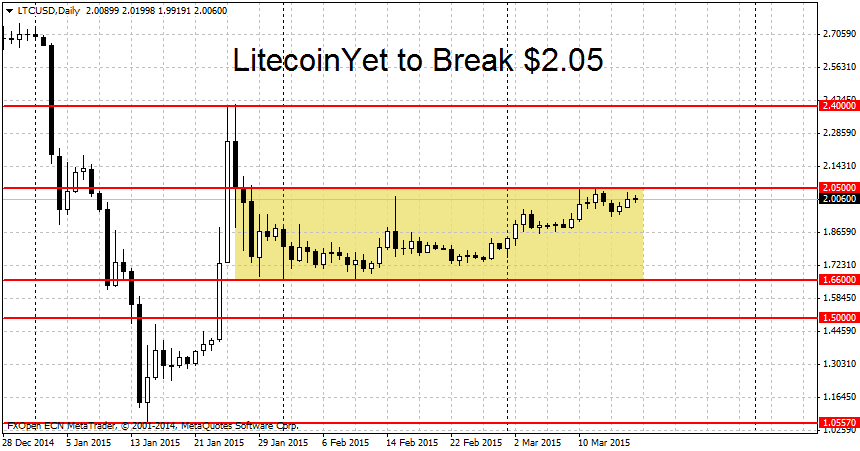
We are currently trading just 2.5 percent below the mark at $2.006. With both BTC and LTC trading so close to their potential breakout points, if you’re bullish on Litecoin it may be better to wait for Bitcoin to break $300 first. Big brother is only 4 percent away from this round figure, so if a LTC rally happens, you probably wont miss much of the move by waiting.
Beyond $2 dollars the first important resistance level for Litecoin can be found at the previous swing high at $2.40. This number ended the January rally in LTC/USD. Higher up, we have notable resistance levels at $2.70, $3 dollars and $3.40 per coin. Since Litecoin is yet to breakout from its range, a clearing of the low of this congestion area at $1.66 dollars may spark a downtrend in prices. Important support levels below include $1.50 and $1.05.
FXOpen offers the world's most popular cryptocurrency CFDs*, including Bitcoin and Ethereum. Floating spreads, 1:2 leverage — at your service (additional fees may apply). Open your trading account now or learn more about crypto CFD trading with FXOpen.
*Important: At FXOpen UK, Cryptocurrency trading via CFDs is only available to our Professional clients. They are not available for trading by Retail clients. To find out more information about how this may affect you, please get in touch with our team.
This article represents the opinion of the Companies operating under the FXOpen brand only. It is not to be construed as an offer, solicitation, or recommendation with respect to products and services provided by the Companies operating under the FXOpen brand, nor is it to be considered financial advice.
Stay ahead of the market!
Subscribe now to our mailing list and receive the latest market news and insights delivered directly to your inbox.


Latest articles

Amazon Earnings: Does the Chart Already Know Something the Numbers Don't?
All eyes are on July 30, when Amazon reports Q2 2026 earnings, with Wall Street increasingly convinced the bar has been set too low. Consensus sees EPS near $1.82-$2.26 on roughly $197 billion in revenue, but the

WTI Analysis: Gap Breaks Short-Term Trend as Price Remains Trapped Between the POC and Profile Boundary
WTI crude oil plunged by more than 7% on 27 July 2026 after the US suspended a series of strikes against Iran over the weekend, raising hopes of a diplomatic solution and the reopening of shipping through the Strait of

US Dollar Index: A Defining Week for the King of the Markets
The dollar heads into a pivotal week trading near 101.80, just off a 15-month high, with the Fed's July 29 meeting standing as the clear focal point. Markets currently price roughly a 65% chance of a hold, though renewed