


Bitcoin Surges to New Highs
FXOpen

Bitcoin surged to new highs during the past seven days. The crypto is up by $694 since last Tuesday or just over 20 percent. Litecoin isn’t doing as well, however. It’s back in range after the losses today.
Bitcoin Surges by $694 Dollars
Bitcoin prices hit a new all-time high of $4,420 dollars yesterday. Since then we’ve dropped a bit and are currently quoted at $4,077, still up by over 20 percent in the last 7 days.
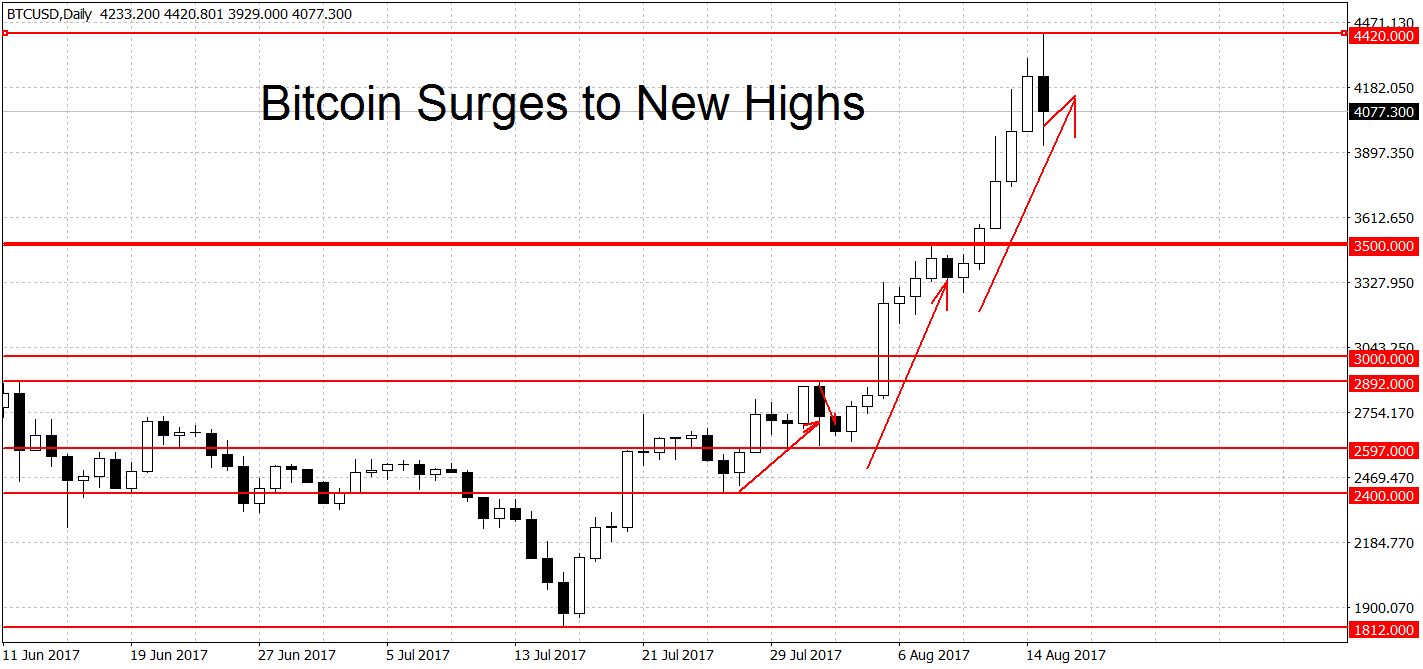
As you can see on the chart above, the steady uptrend continues. The market seems to be well supported by the expected Segwit activation. Current projections put the time of activation on August 22nd, around 18 GMT. At some point, market participants will ‘sell the news’ but that will probably happen closer to the activation date.
The daily charts are still looking bullish. The bears will have to push BTC/USD below the $3,000 level to end the current uptrend. Above here support can be found at the $3,500 round figure, closely followed by the $3,495 swing high. Further up today’s low at $3,929 on FXOpen could act as short-term support, followed by the $4,000 round number.
The all-time high at $4,420 will present some challenge to rising prices but a more important level should be the $4,500 round figure. A breakout above here could lead to more gains toward the $5,000 level. On the longer-term weekly and monthly charts, bitcoin is in rally mode as well.
Failed Breakout for Litecoin
Unlike its big brother, Litecoin hasn’t been doing as well. The crypto is down a lot versus BTC and stayed mostly flat versus the U.S. Dollar until today. The pair lost $3 dollars today, or close to 7 percent. This was enough to push LTC/USD back into neutral territory.
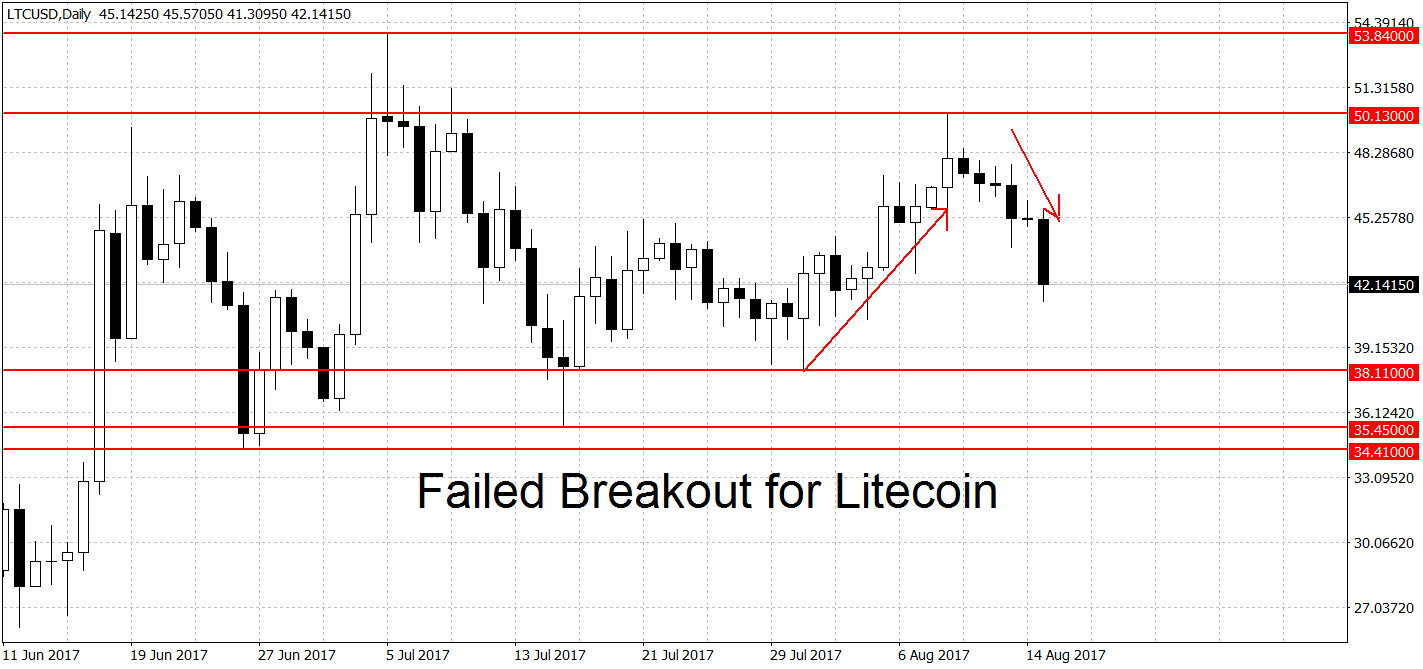
A new rally requires a break above $52 dollars. As usual, we’re looking a for a sustained break above these levels, not just a brief and shallow spike. Resistance above can be found at the $53.85 all-time high on FXOpen and around $57 on other LTC trading venues. A breakout above here could intensify the gains.
On the other end, the bears need a move below the $38.11 swing low. A breakdown below here could start a new downtrend in prices. We have support at $35.45 and $34.41 dollars per coin. A clearing of this support area could open the door to the $30 round figure. Despite the neutral stance on the daily charts, on the long-term charts, LTC/USD remains in a bullish trend.
Bitcoin trading: Forex broker FXOpen.
FXOpen offers the world's most popular cryptocurrency CFDs*, including Bitcoin and Ethereum. Floating spreads, 1:2 leverage — at your service (additional fees may apply). Open your trading account now or learn more about crypto CFD trading with FXOpen.
*Important: At FXOpen UK, Cryptocurrency trading via CFDs is only available to our Professional clients. They are not available for trading by Retail clients. To find out more information about how this may affect you, please get in touch with our team.
This article represents the opinion of the Companies operating under the FXOpen brand only. It is not to be construed as an offer, solicitation, or recommendation with respect to products and services provided by the Companies operating under the FXOpen brand, nor is it to be considered financial advice.
Stay ahead of the market!
Subscribe now to our mailing list and receive the latest market news and insights delivered directly to your inbox.


Latest articles

US Dollar Index: A Defining Week for the King of the Markets
The dollar heads into a pivotal week trading near 101.80, just off a 15-month high, with the Fed's July 29 meeting standing as the clear focal point. Markets currently price roughly a 65% chance of a hold, though renewed

NZD/USD: Inflation Surge Meets Strong US Dollar Pressure
On 21 July, Stats NZ reported an acceleration in inflation: the Consumer Price Index rose 1.5% in the second quarter, while the annual inflation rate climbed to 4.1%, its highest level in more than two years and slightly

Weekly Market Insights with Gary Thomson: The Week of Central Banks and Earnings
In this video, we’ll explore the key economic events and market trends, shaping the financial landscape. Get ready for insights into financial markets to help you navigate the week ahead. Let’s dive in!
In this episode of Market