


BTC and XRP - Ascending Channel Near A Breakout
FXOpen
BTC/USD
From last Tuesday when the price of Bitcoin was sitting at $6768 on it’s lowest point we have seen an impulsive increase leading the price for a 14.95% increase measured to it’s highest point today which was at $7780 so far.
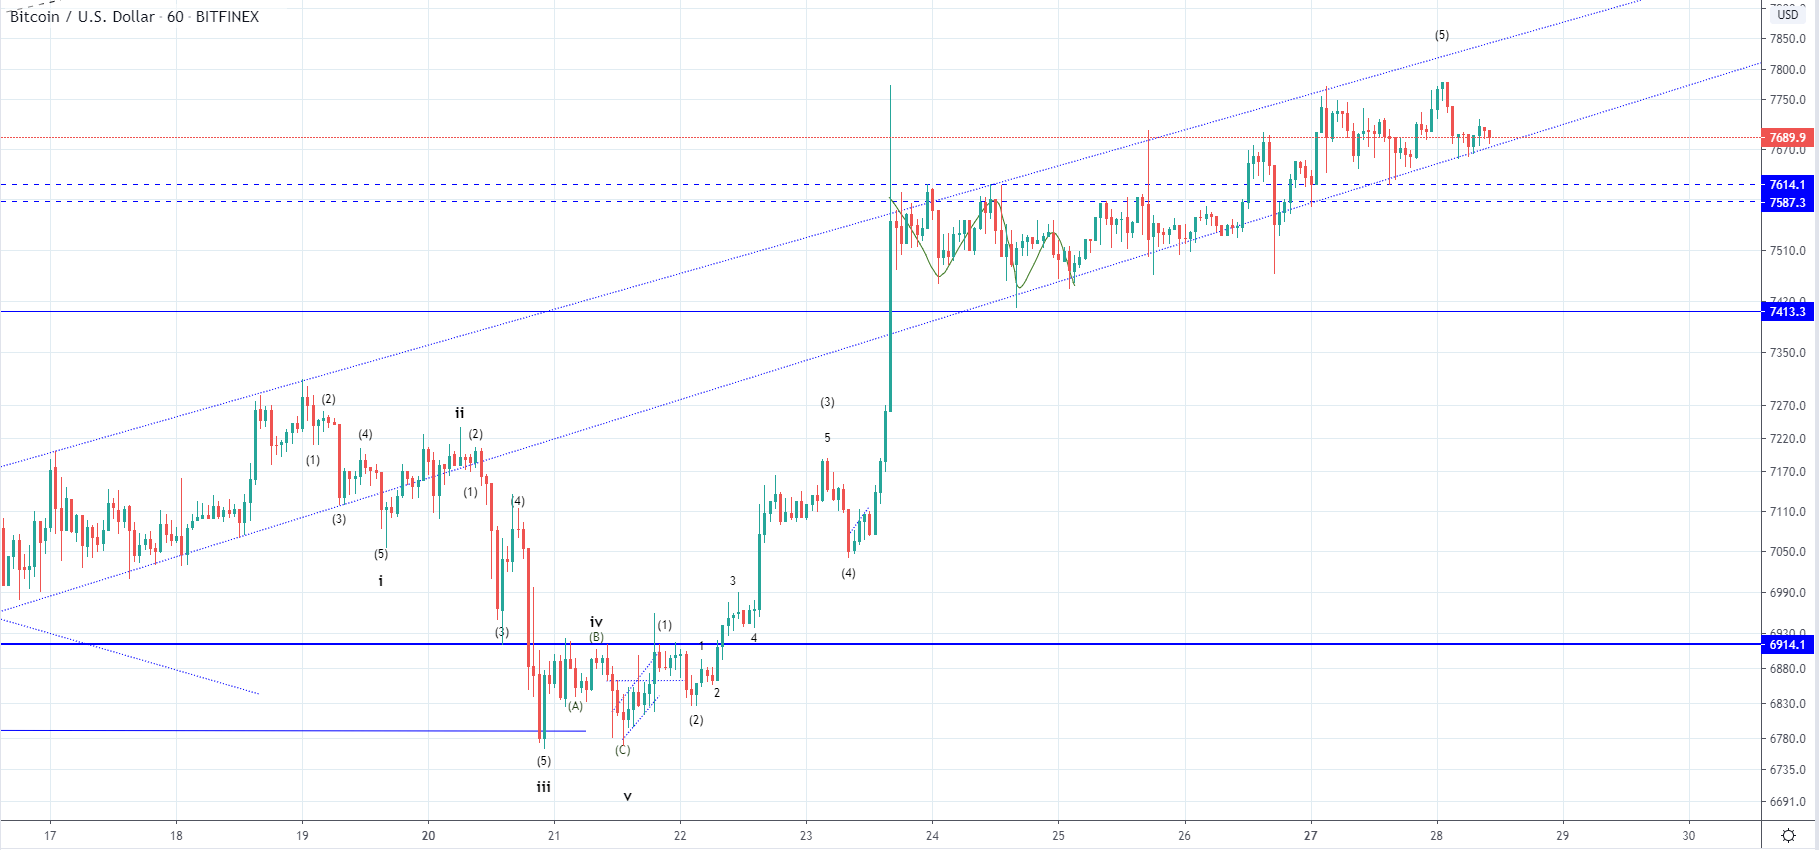 On the hourly chart, you can see that the price increased in a parabolic manner last week spiking above the $7400 area which was considered a significant horizontal resistance which was the highest point the price has been since the 7th of April. This spike was stooped out at the next minor horizontal range around $7600 but the price managed to go above this area as well.
We have seen the formation of the ascending channel from the spike’s ending point but was also the continuation of the previous ascending range made until the 19th of April when the price broke to the downside. The same can be expected now especially considering the amount of increase we have seen in this short period.
Another increase from here to the ascending channels resistance level could occur but as the wave structure implies this is the ending wave out of the five-wave impulse wave and especially as we have seen this ascending range it could mark the completion of the 5th wave in an ending diagonal.
If we see a breakout to the downside which I believe is more likely the mentioned horizontal levels are to be retested for support, but if the price continues increasing from here I would be expecting it to continue for much longer approximately to around $7880 level.
XRP/USD
The price of Ripple has increased by 10.94% from last Tuesday when it was sitting on it’s lowest at $0.17908 measured to the highest point the price has been yesterday at $0.1986.
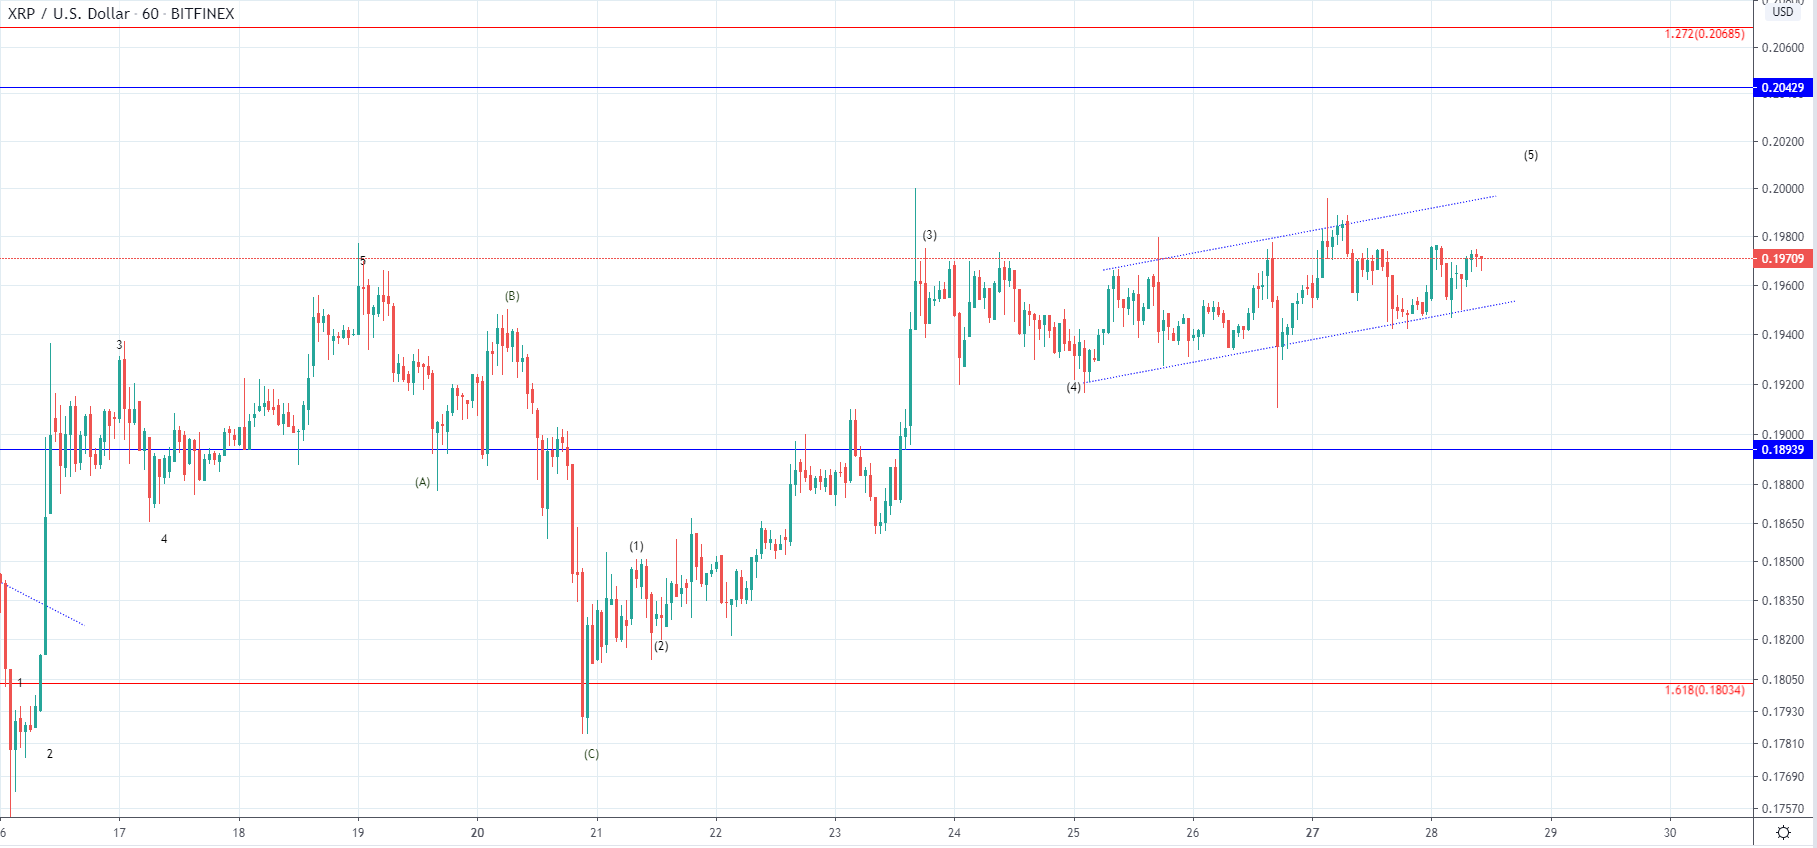 Looking at the hourly chart, we can see that the price came up above the $0.18939 which served as a significant horizontal resistance but the increase was stopped out the vicinity of the prior high. As we have seen the formation of the ascending channel like in the case of Bitcoin it could also indicate that this is the ending wave out of the five-wave impulse. If that is true then the price could increase for another retest of its resistance level which would bring the price to $0.2 at its highest point, but after that, I would be expecting a breakout to the downside.
Another possibility could be that the seen ascending channel is the first sub-wave out of the next impulsive move to the upside in which case we are to see a breakout from the upside but that’s now as likely at this point.
FXOpen offers the world's most popular cryptocurrency CFDs*, including Bitcoin and Ethereum. Floating spreads, 1:2 leverage — at your service (additional fees may apply). Open your trading account now or learn more about crypto CFD trading with FXOpen.
*Important: At FXOpen UK, Cryptocurrency trading via CFDs is only available to our Professional clients. They are not available for trading by Retail clients. To find out more information about how this may affect you, please get in touch with our team.
This article represents the opinion of the Companies operating under the FXOpen brand only. It is not to be construed as an offer, solicitation, or recommendation with respect to products and services provided by the Companies operating under the FXOpen brand, nor is it to be considered financial advice.
Stay ahead of the market!
Subscribe now to our mailing list and receive the latest market news and insights delivered directly to your inbox.


Latest articles

DAX 40: consolidation amid technology sell-off
A wave of selling in the technology sector that emerged earlier this week has weighed on European equities. The trigger was investor concern over the profitability of large-scale debt-funded investments by major US tech companies in AI infrastructure. The Nasdaq

Euro Hits Fresh Yearly Lows Amid Dovish ECB Signals
The euro remains under pressure following weak macroeconomic data from the euro area and fresh signals that the European Central Bank is prepared to maintain a more accommodative monetary policy stance. Data released yesterday pointed to a deterioration in business

Pound at Key Levels: Markets Assess Impact of Political Uncertainty in the UK
The British pound remains under pressure following increased political uncertainty in the United Kingdom triggered by the Prime Minister’s resignation. Investors are assessing potential shifts in the political and economic policy outlook after the head of government stepped down,