


FXOpen

BTC/USD
From yesterday’s high at $7592 the price of Bitcoin has decreased by 3.55% as it came down to $7322 at its lowest point today. It’s currently being traded at $7377 which is slightly higher with the price being stuck in a resistance range.
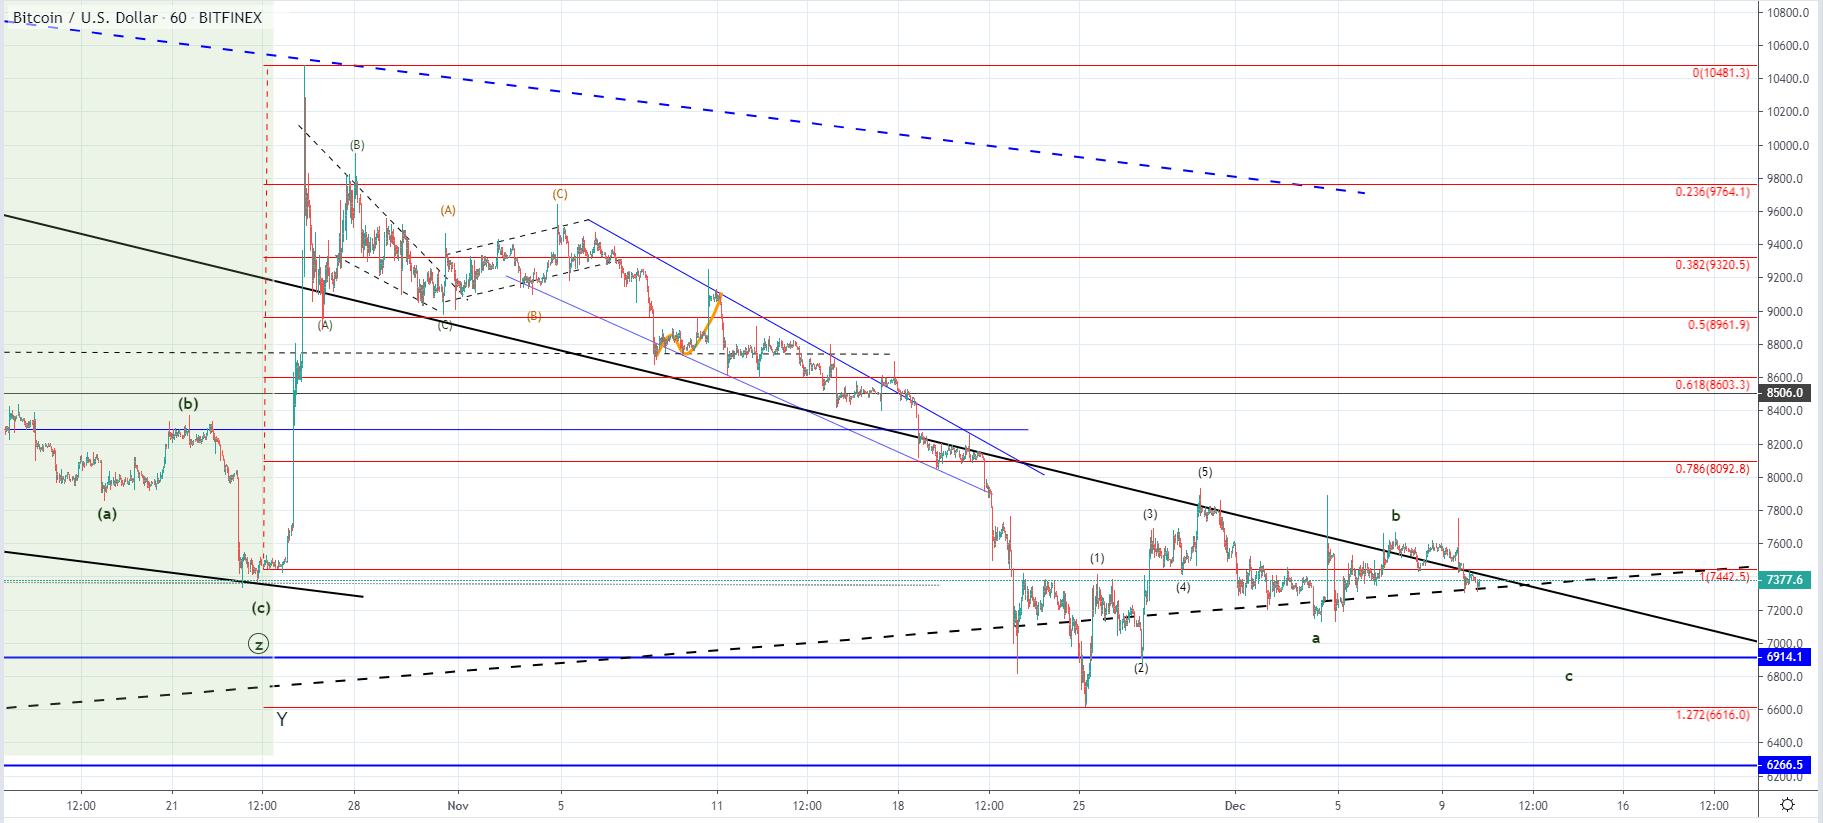 On the hourly chart, you can see that the price is inside the apex of the symmetrical triangle formed by the interrupted ascending trendline and the descending channels resistance level. The price is retesting both levels and is why it’s stuck in this range so a breakout would be expected shortly.
The interrupted ascending trendline dates back from February when the next wave to the upside started and served as the first baseline support from the move to the upside. The level has been pierced on the 25th of November when the price spiked to the 1.272 Fibonacci level but this resulted in a strong buying activity as the price came back to retest the descending channels resistance. The price increase was made in a five-wave manner which indicates impulsiveness which was expected to start as the previous downfall most likely ended on the Fib level interaction.
If this is true the currently seen structure could be a three-wave correction which is why another move to the downside could be expected from here to the $6914 horizontal support before further movement to the upside continues.
XRP/USD
The price of Ripple has decreased by 4.4% from yesterday’s open at $0.23235 as it came down to $0.22215 at its lowest point today. Last week on Thursday a minor recovery has started and pushed the price above the 1 Fib level but since then a minor retracement has been made below it. This could be an early indication that the price decrease would continue further as the level hasn’t served as support.
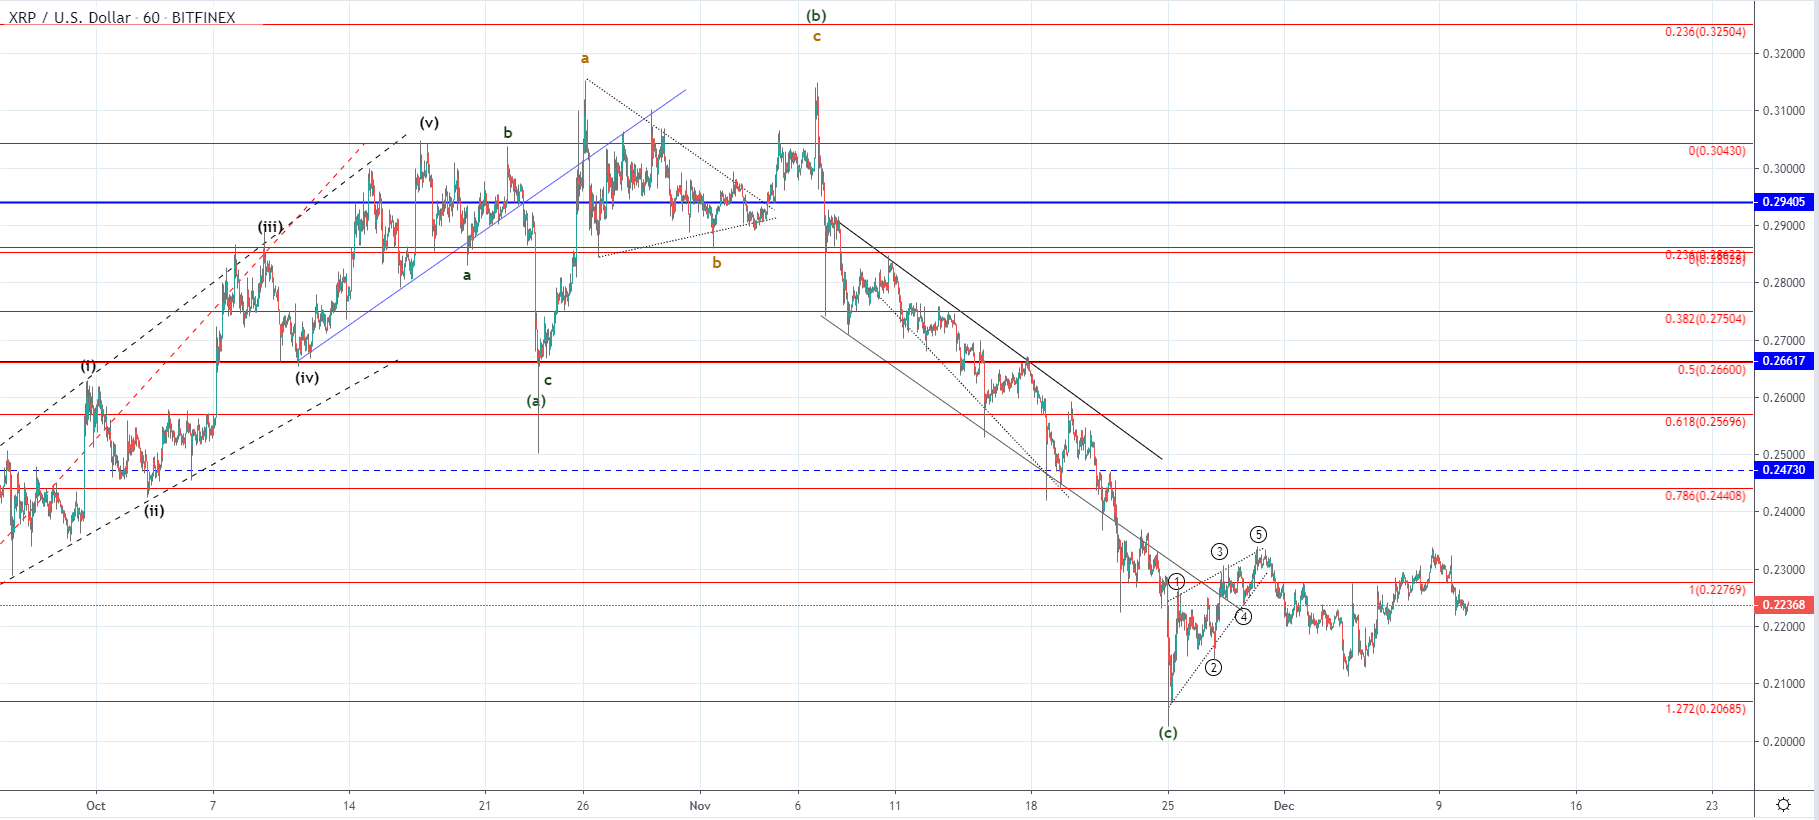
On the hourly chart, you can see that the price of Ripple moved sideways since the interaction with the 1.272 Fibonacci level and reached a prior high level without surprising it before another downturn started. As the price made an ascending triangle on the previous increase and then went on to decrease on a higher low this could be the start of the 3rd wave to the upside out of which we are seeing the 1st sub-wave.
But more likely, since the last increase looks choppy and corrective we have seen a three-wave sideways move which is another correction before further lower lows. If this is true then this could be the 4th structure out of the wxyxz correction of a higher degree which would mean that the price of Ripple is headed further to the downside as the Z wave should develop fully. This will be validated but the depth of the current retracement as well as the momentum of the next move to the upside.
FXOpen offers the world's most popular cryptocurrency CFDs*, including Bitcoin and Ethereum. Floating spreads, 1:2 leverage — at your service. Open your trading account now or learn more about crypto CFD trading with FXOpen.
*At FXOpen UK and FXOpen AU, Cryptocurrency CFDs are only available for trading by those clients categorised as Professional clients under FCA Rules and Professional clients under ASIC Rules respectively. They are not available for trading by Retail clients.
This article represents the opinion of the Companies operating under the FXOpen brand only. It is not to be construed as an offer, solicitation, or recommendation with respect to products and services provided by the Companies operating under the FXOpen brand, nor is it to be considered financial advice.
Stay ahead of the market!
Subscribe now to our mailing list and receive the latest market news and insights delivered directly to your inbox.

Latest articles

Weekly Market Wrap With Gary Thomson: Nasdaq, EUR/USD, USD/CHF, Brent Crude Oil, Googl Shares
Get the latest scoop on the week's hottest headlines, all in one convenient video. Join Gary Thomson, the COO of FXOpen UK, as he breaks down the most significant news reports and shares his expert insights.
- Nasdaq Composite: Worst Session

Analysis of AUD/USD: Exchange Rate Falls to Early May Low
As indicated by the 4-hour AUD/USD chart today:
→ the rate fell below 0.652, a level last seen on May 2;
→ the RSI indicator dropped below 15, a level last seen during the panic over the spread of COVID-19

Analysis of AMZN Stock: Price at 1.5-Month Low
As shown in the AMZN chart, the stock price dropped below:
→ the psychological level of $180;
→ the mid-June interim low.
The last time AMZN traded below $180 was in early June.
Thus, AMZN has faced sell-offs, similar to other tech