


BTC and XRP - Breakout To The Downside Seen
FXOpen

BTC/USD
Last Friday the price of Bitcoin came down to around $10455 area from its second attempt to surpass the $10931 level which ended as a failure. Since this drop of around 4.5% occurred we have seen the formation of an ascending channel in which the price action bounced until today when a minor breakout started developing after the price reached $10818 at its highest.
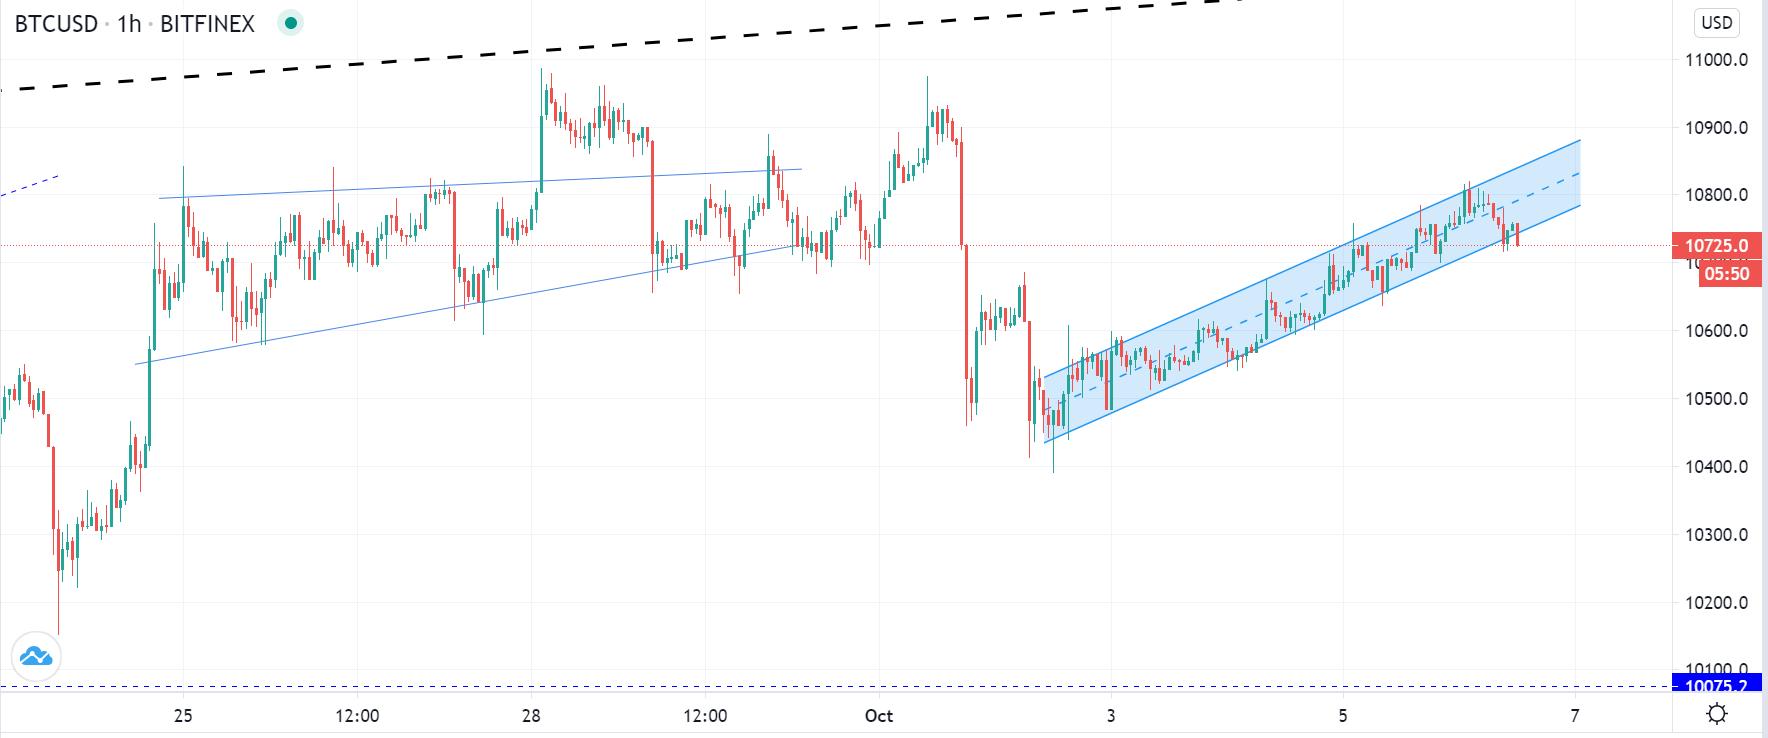
The price came above its significant horizontal support that served as resistance at around $10700 but it is struggling to keep up the upward momentum. On the hourly chart, we can see that it appears that a breakout is currently being made with the current hourly candle being opened below the channels support level.
This is why we are likely to see a breakout continuation to at least $10650 or $10590 where the next significant horizontal support levels are and make the support zone which was broken on the 1st of October.
If the price finds support there and continues moving above $10700 area then the ascending channel could have been the next sub-wave of the upward impulse wave but if the price goes below the mentioned support zone the ascending channel would have likely been a corrective structure after which further lows could be seen.
XRP/USD
The price of Ripple has increased further then in the case of Bitcoin as from its last Friday’s low at $0.23 we have seen an increase of 13% measured to its highest point at $0.26 made today. As the price reached today’s high it started impulsively declining and is currently being traded just slightly below $0.25 level but a breakout has been made below the ascending trendline.
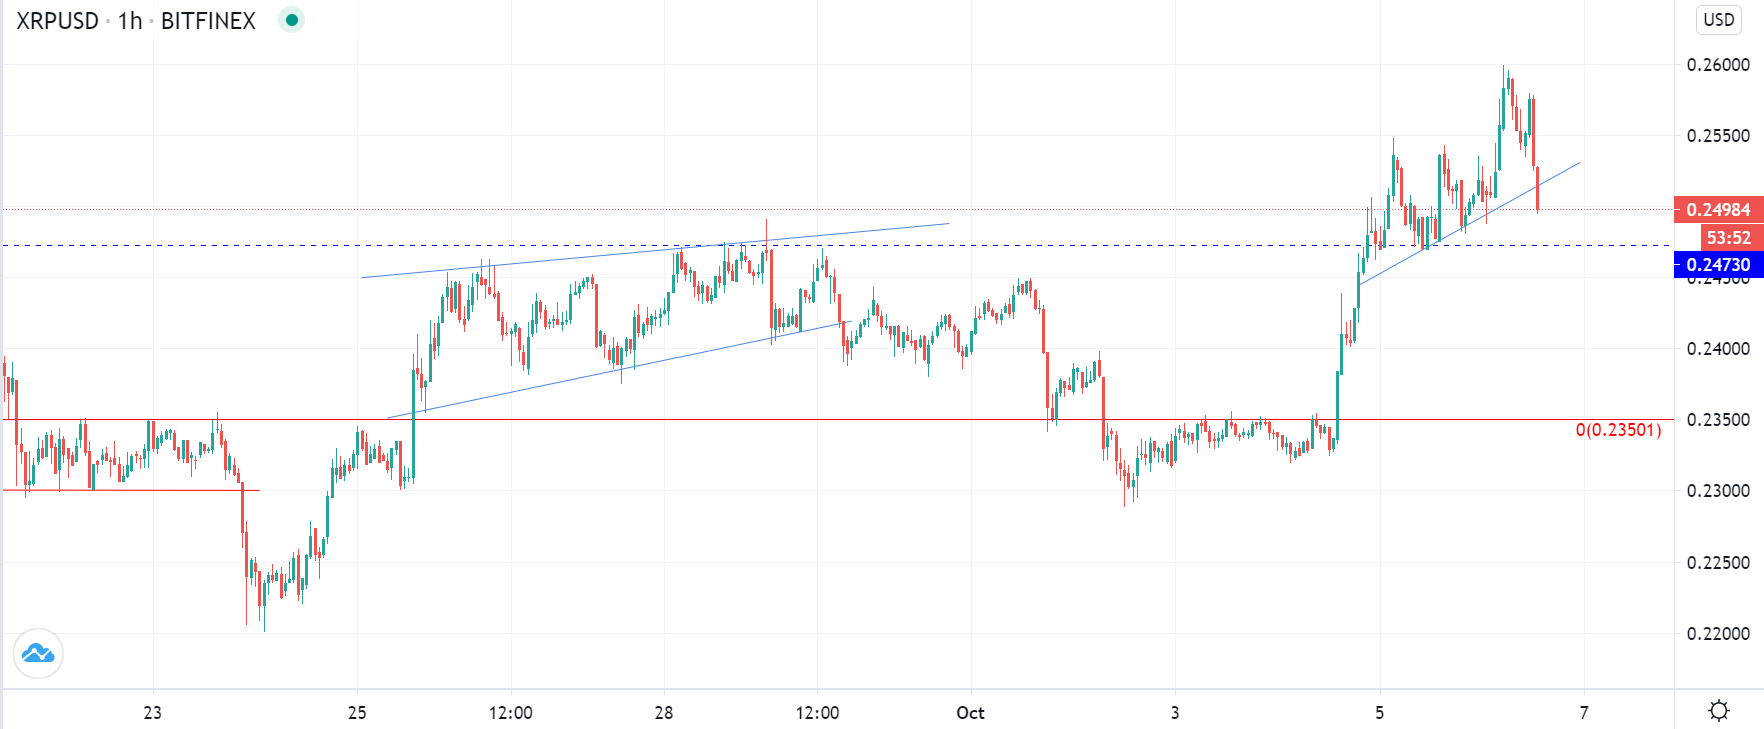
Yesterday the price found support on the horizontal level at $0.24730 which is why another interaction now looks highly likely but it is still unclear whether or not the price is going to find support there for the second time. This is the level from the prior high made on the 28th of September which is why its retest could be seen again, especially if the price wants to continue its upward movement.
Considering that we have seen a higher low last Friday, October the 2nd compared to the one made on the 24th of September an uptrend continuation looks likely at this stage. This is why the horizontal level at $0.24730 will serve as a pivot point whose interaction is going to provide an early indication on whether or not the uptrend is to continue in the upcoming period.
FXOpen offers the world's most popular cryptocurrency CFDs*, including Bitcoin and Ethereum. Floating spreads, 1:2 leverage — at your service (additional fees may apply). Open your trading account now or learn more about crypto CFD trading with FXOpen.
*Important: At FXOpen UK, Cryptocurrency trading via CFDs is only available to our Professional clients. They are not available for trading by Retail clients. To find out more information about how this may affect you, please get in touch with our team.
This article represents the opinion of the Companies operating under the FXOpen brand only. It is not to be construed as an offer, solicitation, or recommendation with respect to products and services provided by the Companies operating under the FXOpen brand, nor is it to be considered financial advice.
Stay ahead of the market!
Subscribe now to our mailing list and receive the latest market news and insights delivered directly to your inbox.


Latest articles

EUR/USD Eyes Gains As USD/CHF Weakness Deepens Again
EUR/USD started a fresh increase above 1.1700 and 1.1720. USD/CHF declined further and is now struggling below 0.7835.
Important Takeaways for EUR/USD and USD/CHF Analysis Today
· The Euro started a decent increase from

Apple: Earnings Day Above the Activity Zone
On 30 April, after the market close, Apple Inc. will release its financial results for the second quarter of fiscal 2026. The consensus forecast, based on estimates from 31 analysts, points to revenue of around $109.7 billion, with expected

USD/JPY and USD/CHF Near Key Levels: The Dollar Supported by the Fed
The US dollar continues to trend upwards following the Federal Reserve meeting, drawing support from the regulator’s moderately hawkish stance and comments by Jerome Powell. Markets interpret the Fed’s rhetoric as a signal that restrictive policy is likely