


FXOpen

BTC/USD
The price of Bitcoin has broken out from its prior resistance and impulsively came to $48,200 at its highest point today. From its lowest point on Sunda when it was sitting around $37,430, this is an increase of 28%. Currently, a minor retracement is being made with the price sitting at $46,604 but is still in an upward trajectoty.

This breakout indicates that the prior correctional formation from the 10th of January has ended and now we have a clear confirmation with the bullish momentum indicating a strong uptrend continuation. After the five-wave move inside the ascending channel was ended we have seen a minor pullback but an immediate breakout to the upside. This was most likely the 3rd sub-wave of the higher degree 3rd wave which is why further upside movement would now be expected.
As the price is to develop its five-wave pattern further higher highs could be seen in the upcoming days with potentially exceeding the $60,000 mark by the end of its development. However not that an impulsive breakout has seen a local correction might form as the 4th wave should develop before further upside. It is still unclear where the 4th wave could land but most likely we are going to see a retest of the prior all-time high before uptrend continuation.
XRP/USD
From Sunday’s low at $0.39, the price of Ripple has increased by 29% today as it came up to $0.48985 at its highest point. Since then we have seen a pullback but only to the prior horizontal resistance level which is now being tested for support.
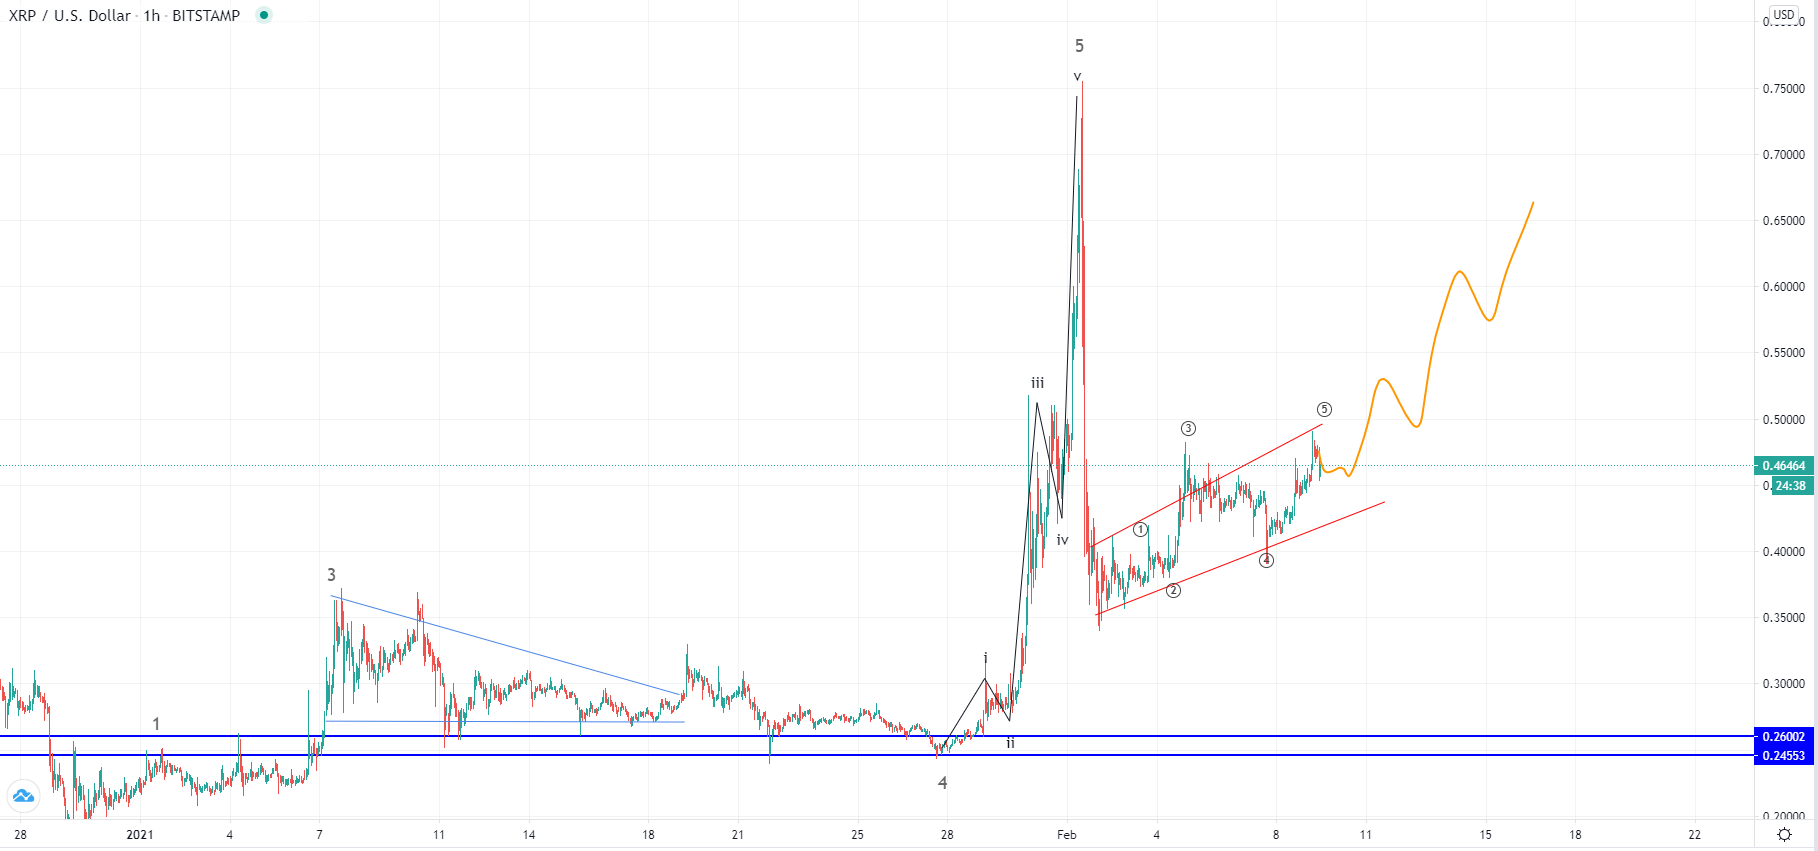
On the hourly chart, you can see that the price made an ascending channel from the start of February after a shart correction was made. As previously the price made a significant rise, followed by a significant downside movement, now it started moving slowly back up. It did so in a five-wave manner which indicates that this is most likely the start of the next impulse wave to the upside out of the higher degree count.
As the five-wave move inside the ascending channel ended now we could expect to see the pullback continuation. It could end again around the ascending support but more likely it isn’t going to be that deep and could instead end around the channels mid-range. From there another impulse wave should form pushing the price above $0.65 again which would be the 3rd wave out of the higher degree impusle, which new highs ahead.
This forecast represents FXOpen Markets Limited opinion only, it should not be construed as an offer, invitation or recommendation in respect to FXOpen Markets Limited products and services or as financial advice.
Cryptocurrency CFDs are not available to trade in all jurisdictions.
FXOpen offers the world's most popular cryptocurrency CFDs*, including Bitcoin and Ethereum. Floating spreads, 1:2 leverage — at your service. Open your trading account now or learn more about crypto CFD trading with FXOpen.
*At FXOpen UK and FXOpen AU, Cryptocurrency CFDs are only available for trading by those clients categorised as Professional clients under FCA Rules and Professional clients under ASIC Rules respectively. They are not available for trading by Retail clients.
This article represents the opinion of the Companies operating under the FXOpen brand only. It is not to be construed as an offer, solicitation, or recommendation with respect to products and services provided by the Companies operating under the FXOpen brand, nor is it to be considered financial advice.
Stay ahead of the market!
Subscribe now to our mailing list and receive the latest market news and insights delivered directly to your inbox.

Latest articles

Weekly Market Wrap With Gary Thomson: Nasdaq, EUR/USD, USD/CHF, Brent Crude Oil, Googl Shares
Get the latest scoop on the week's hottest headlines, all in one convenient video. Join Gary Thomson, the COO of FXOpen UK, as he breaks down the most significant news reports and shares his expert insights.
- Nasdaq Composite: Worst Session

Analysis of AUD/USD: Exchange Rate Falls to Early May Low
As indicated by the 4-hour AUD/USD chart today:
→ the rate fell below 0.652, a level last seen on May 2;
→ the RSI indicator dropped below 15, a level last seen during the panic over the spread of COVID-19

Analysis of AMZN Stock: Price at 1.5-Month Low
As shown in the AMZN chart, the stock price dropped below:
→ the psychological level of $180;
→ the mid-June interim low.
The last time AMZN traded below $180 was in early June.
Thus, AMZN has faced sell-offs, similar to other tech