


FXOpen

BTC/USD
The price of Bitcoin has increased since yesterday’s low at $13206 to $13703 where it is currently being traded. This is a 4.16% recovery after the price fell from slightly above the $14000 level which was interacted with on Saturday. As the interaction ended as a rejection another pullback has been seen but again high at a higher low compared to the one made last Thursday which is still bullish.
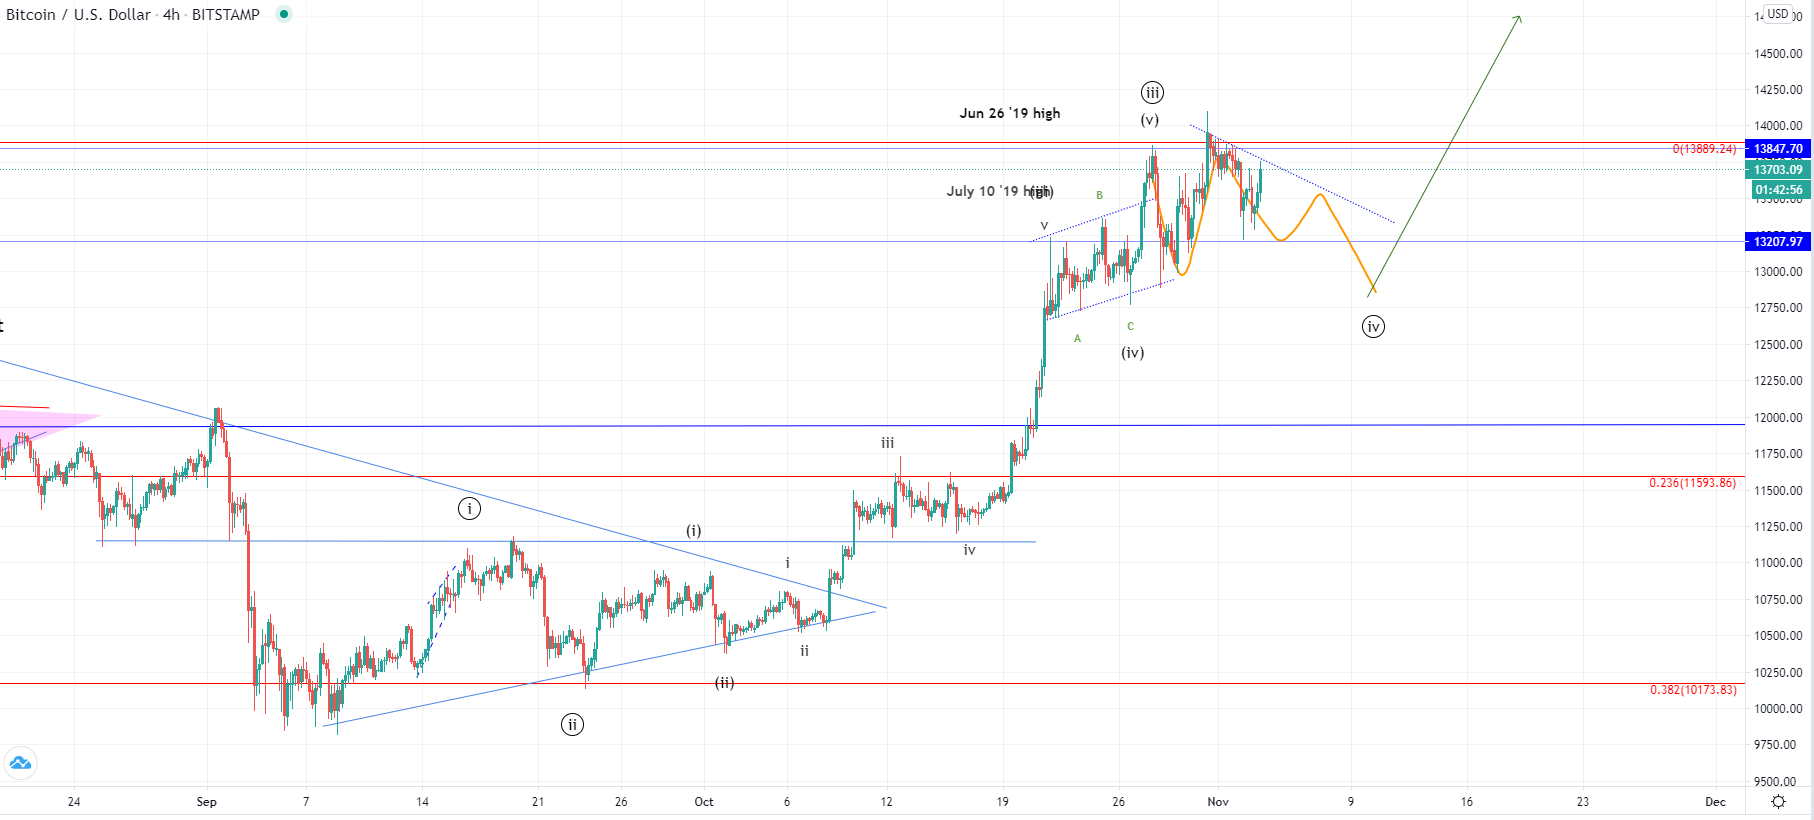
On the 4-hour chart, we can see that the interaction with the $14000 level was a retest of the last year’s highest point made on June 26th and was the second one. Since we have seen another failure for a breakout the price has started moving sideways but is still showing bullish signs with higher lows being made. Now that it made an interaction with the $13207 level spiking to the downside for its retest another upward movement has been seen, but it could be a corrective one. This is especially considering the descending trendline which is being formed and with whom we are currently seeing an interaction.
If the price ended its impulsive move which was the 3rd wave of the Minute count, we are now seeing the 4th corrective wave developing. This will shortly be validated by the interaction with the still unconfirmed descending trendline as if the price finds resistance here it could be an early indication that it is going into further sideways movement and to the downside. But overall the price would be expected to continue moving to the upside as the 5th wave should develop.
XRP/USD
From the 22nd of October, the price of Ripple has decreased by 12.68% coming from $0.2627 at its highest point to $0.22941 on its yesterday’s low. Since then we have seen a minor recovery with the price being traded at $0.2393.
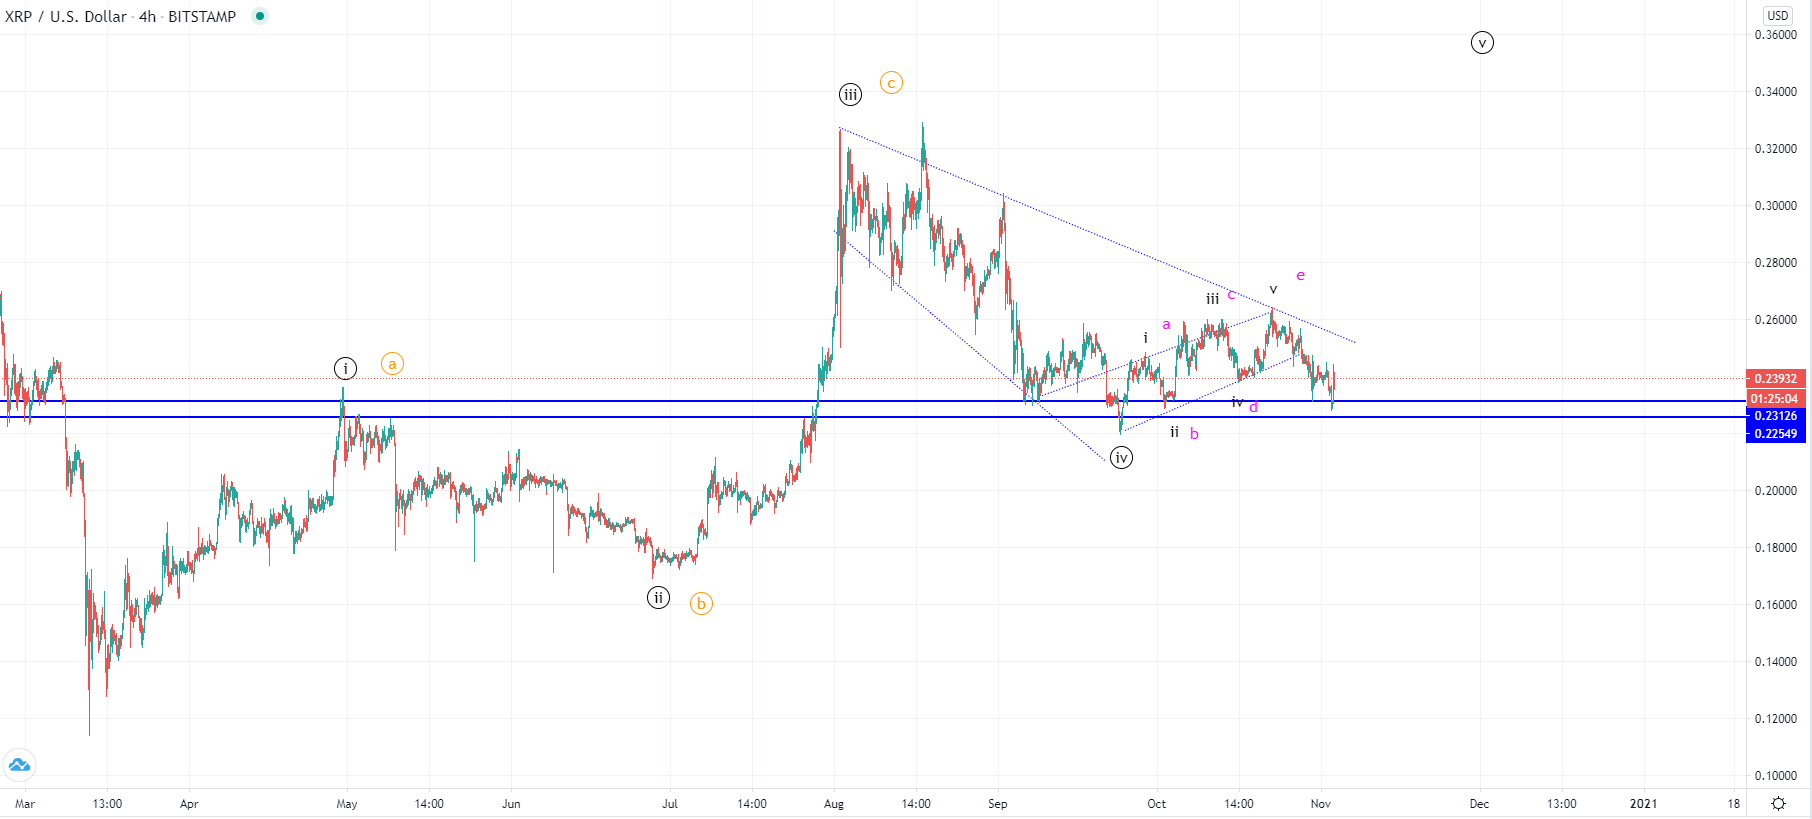
On the 4-hour chart, we can see that the price found support at the significant horizontal zone which served as resistance and has now been tested for support after the price broke out on its upper side in August. This decline occurred after a five-wave increase that developed an ascending channel which could have been a leading diagonal from the next starting impulse to the upside. This would be a bullish scenario in which from March we have seen a five-wave impulse wave with the 5th one currently in development.
Another possibility would be that from March we have seen a three-wave corrective count in which case the ascending channel formed prior to the current decline was an ABCDE correction. If this is true then the descending move is the continuation of the new wave to the downside that started on the 2nd of August. As the price found support on the 1st wave’s ending point both possibilities are still in play, but if it continues moving further to the downside and enters the territory of the presumed 1st wave that would invalidate the five-wave count and would mean that from March until August the 2nd wave have seen a corrective ABC to the upside.
FXOpen offers the world's most popular cryptocurrency CFDs*, including Bitcoin and Ethereum. Floating spreads, 1:2 leverage — at your service. Open your trading account now or learn more about crypto CFD trading with FXOpen.
*At FXOpen UK and FXOpen AU, Cryptocurrency CFDs are only available for trading by those clients categorised as Professional clients under FCA Rules and Professional clients under ASIC Rules respectively. They are not available for trading by Retail clients.
This article represents the opinion of the Companies operating under the FXOpen brand only. It is not to be construed as an offer, solicitation, or recommendation with respect to products and services provided by the Companies operating under the FXOpen brand, nor is it to be considered financial advice.
Stay ahead of the market!
Subscribe now to our mailing list and receive the latest market news and insights delivered directly to your inbox.

Latest articles

Weekly Market Wrap With Gary Thomson: Nasdaq, EUR/USD, USD/CHF, Brent Crude Oil, Googl Shares
Get the latest scoop on the week's hottest headlines, all in one convenient video. Join Gary Thomson, the COO of FXOpen UK, as he breaks down the most significant news reports and shares his expert insights.
- Nasdaq Composite: Worst Session

Analysis of AUD/USD: Exchange Rate Falls to Early May Low
As indicated by the 4-hour AUD/USD chart today:
→ the rate fell below 0.652, a level last seen on May 2;
→ the RSI indicator dropped below 15, a level last seen during the panic over the spread of COVID-19

Analysis of AMZN Stock: Price at 1.5-Month Low
As shown in the AMZN chart, the stock price dropped below:
→ the psychological level of $180;
→ the mid-June interim low.
The last time AMZN traded below $180 was in early June.
Thus, AMZN has faced sell-offs, similar to other tech