


BTC and XRP - Bullish sentiment continues
FXOpen

BTC/USD
From last Friday when the price of Bitcoin has been traded at $46,371, we have seen an increase of 17.6% measured to its highest point today at the $54,530 level. After a minor pullback, the price back close to the levels of today’s high and is still on an upward trajectory.
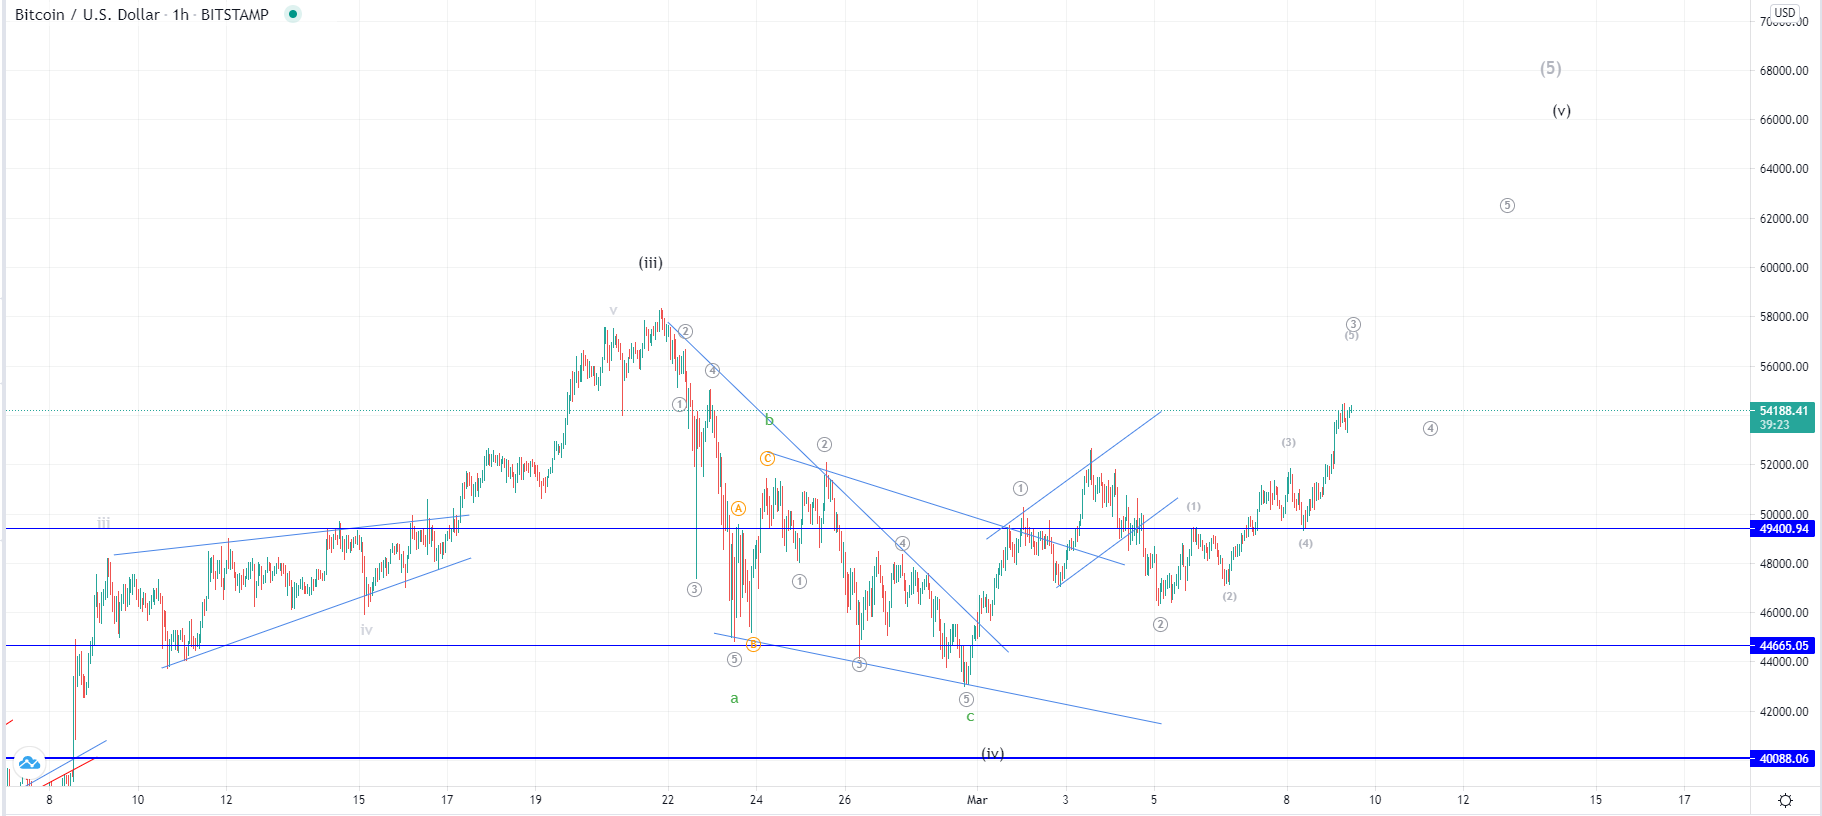
This upside movement is counted as the starting impulse to the upside after a correction ended on the 28th of February. The first two waves should have ended which is why now we are seeing the development of the next 3rd one.
If this is the five-wave impulse the price increase should continue after the completion of this rise which is set to exceed the high on the 3rd. But there is still a possibility that it would end on the 3rd wave in which case that would mean that we have seen the 2nd sub-wave of the higher degree correctional count.
In the first case, a new all-time high would be expected, while in the second the price would go above its low of February 28th which would be the first sub-wave of the higher degree descending move. The pivot point would be the pullback that is expected after the current rise ends, as it manages to stay above the $52,600 area it would validate the 4th wave. But if it continues moving down and even falls below the $50,000 area that would be a clear sign that the price of Bitcoin is headed for a lower low as the 4th wave count would be invalidated.
XRP/USD
The price of Ripple has been rising from the start of the month when it fell to $0.3954 and measured to its highest point today made a recovery of 24% as it came up to $0.4858.

On the hourly chart, we can see that the price entered the horizontal zone which was a significant pivot zone and represents the support/resistance range around which the price has been traded after January’s spike to the upside ended. If we have seen the end of the correction that started from the 1st of February, now a breakout above the $0.5 level could be seen which would validate the bullish scenario.
However, we could see a rejection at the current levels which can cause another downturn in price, which is why we are going to closely monitor what happens at present levels.
This forecast represents FXOpen Markets Limited opinion only, it should not be construed as an offer, invitation or recommendation in respect to FXOpen Markets Limited products and services or as financial advice.
Cryptocurrency CFDs are not available to trade in all jurisdictions.
FXOpen offers the world's most popular cryptocurrency CFDs*, including Bitcoin and Ethereum. Floating spreads, 1:2 leverage — at your service (additional fees may apply). Open your trading account now or learn more about crypto CFD trading with FXOpen.
*Important: At FXOpen UK, Cryptocurrency trading via CFDs is only available to our Professional clients. They are not available for trading by Retail clients. To find out more information about how this may affect you, please get in touch with our team.
This article represents the opinion of the Companies operating under the FXOpen brand only. It is not to be construed as an offer, solicitation, or recommendation with respect to products and services provided by the Companies operating under the FXOpen brand, nor is it to be considered financial advice.
Stay ahead of the market!
Subscribe now to our mailing list and receive the latest market news and insights delivered directly to your inbox.


Latest articles

Weekly Market Insights with Gary Thomson: The Week of Central Banks and Earnings
In this video, we’ll explore the key economic events and market trends, shaping the financial landscape. Get ready for insights into financial markets to help you navigate the week ahead. Let’s dive in!
In this episode of Market

Intel at a Crossroads: Earnings Beat Meets Technical Resistance
Intel has just delivered its strongest quarter in over fifteen years, and the market reaction says it all. Q2 2026 revenue surged 25% year-over-year to $16.1 billion, crushing the consensus estimate of $14.42 billion, while adjusted EPS of

Tesla: Complex Range Structure Breaks Down Following Quarterly Earnings
Tesla released its Q2 2026 results after the market closed on 22 July. Revenue increased 26% year-on-year to $28.24 billion, while vehicle deliveries reached a record 480,126 units. However, operating margin fell sharply to 1.4%, down from