


BTC and XRP - Correction likely ended
FXOpen

BTC/USD
Yesterday the price of Bitcoin reached $7709 at it’s lowest point coming from $9166 high made on Saturday which is a decrease of 15.9% in only two days. Since yesterday’s low, we have seen a minor recovery with the price currently sitting at around $8100 level. This 5.3% increase from yesterday might continue as the price is in an upward trajectory and came above the significant horizontal zone.
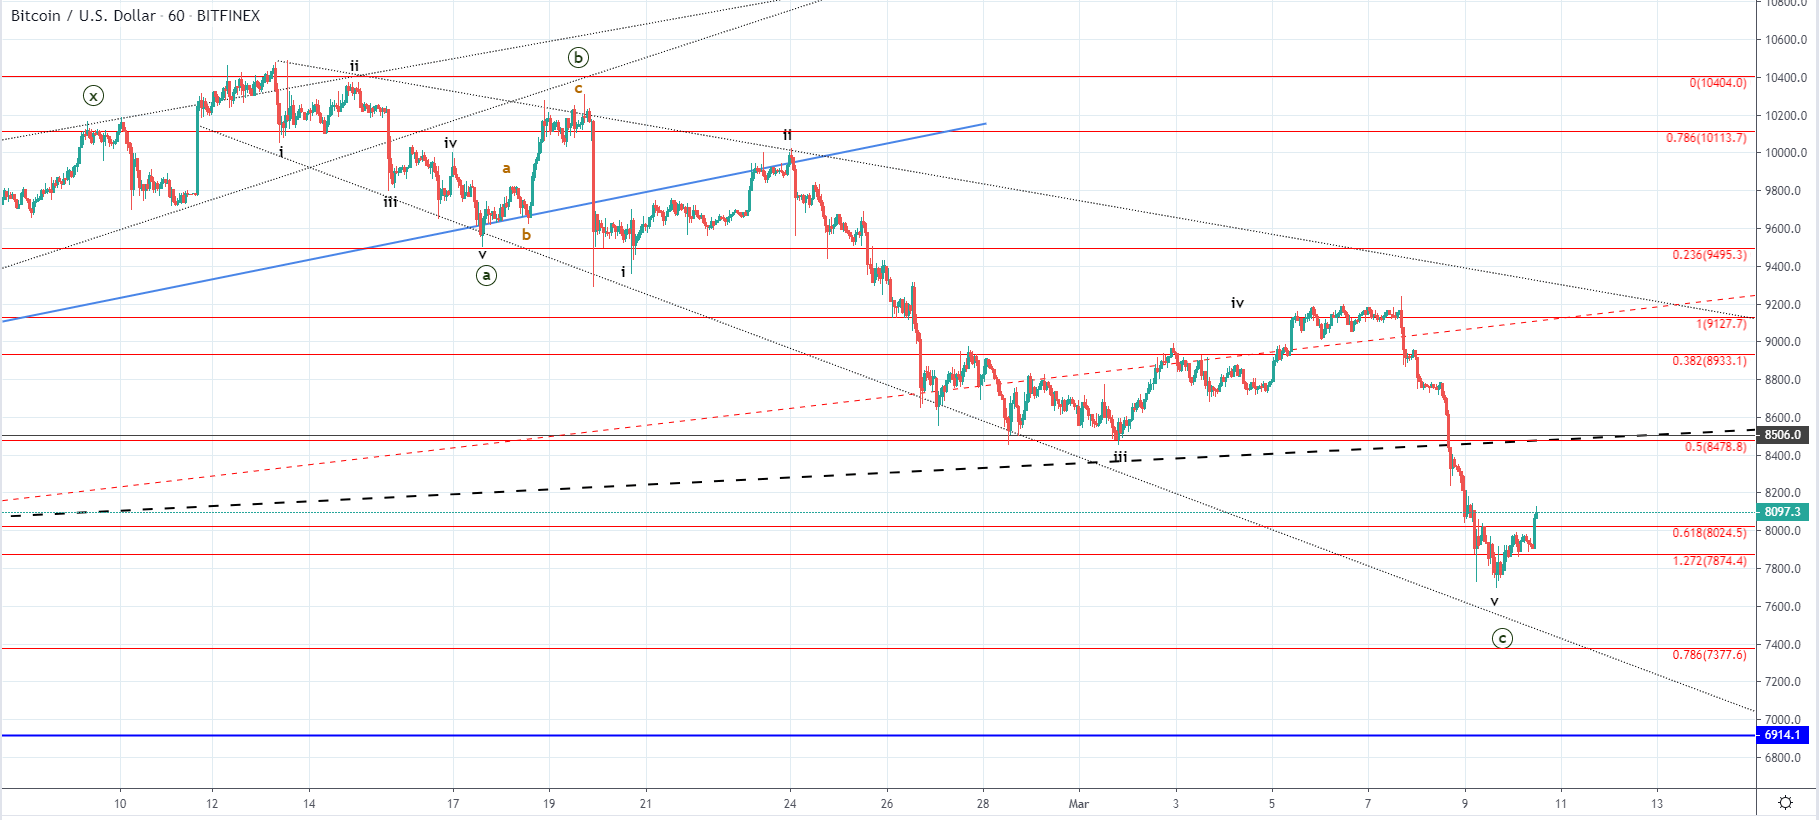
Looking at the hourly chart, we can see that this descending move was caused by rejection at the 1 Fibonacci level of a higher degree count which was actually the ending point of the first corrective move made in June last year after the parabolic increase which developed throughout the first half of the year ended. Thus this was the 4th wave out of the lower degree five-wave impulse to the downside which is the C wave of a Minute count.
This means that we are seeing the development of the 5th wave which might have ended. With the price starting to move to the upside in an impulsive manner and the prior low showing signs of bullish action pushing the price as indicated from the wick on the buyer’s side. However, we haven’t seen interaction with the descending channel’s support level and the 0.618 Fibonacci one of the current correction hasn’t been respected.
We might see another decrease to for a retest of its significant levels and the point of interest would be the intersection of the 0.786 Fibonacci level and the descending channel’s resistance at $7377. If the price, on the other hand, starts further increasing from here and breaks out to the upside above $8506 significant level it could indicate that the ABC move to the downside ended.
XRP/USD
The price of Ripple came down to $0.2 at its lowest point yesterday decreasing by 18.3% from it’s prior high at $0.2458. From there we have seen an increase in around 6% but the price is still in an upward trajectory which is why the price is likely to continue increasing further during the day.
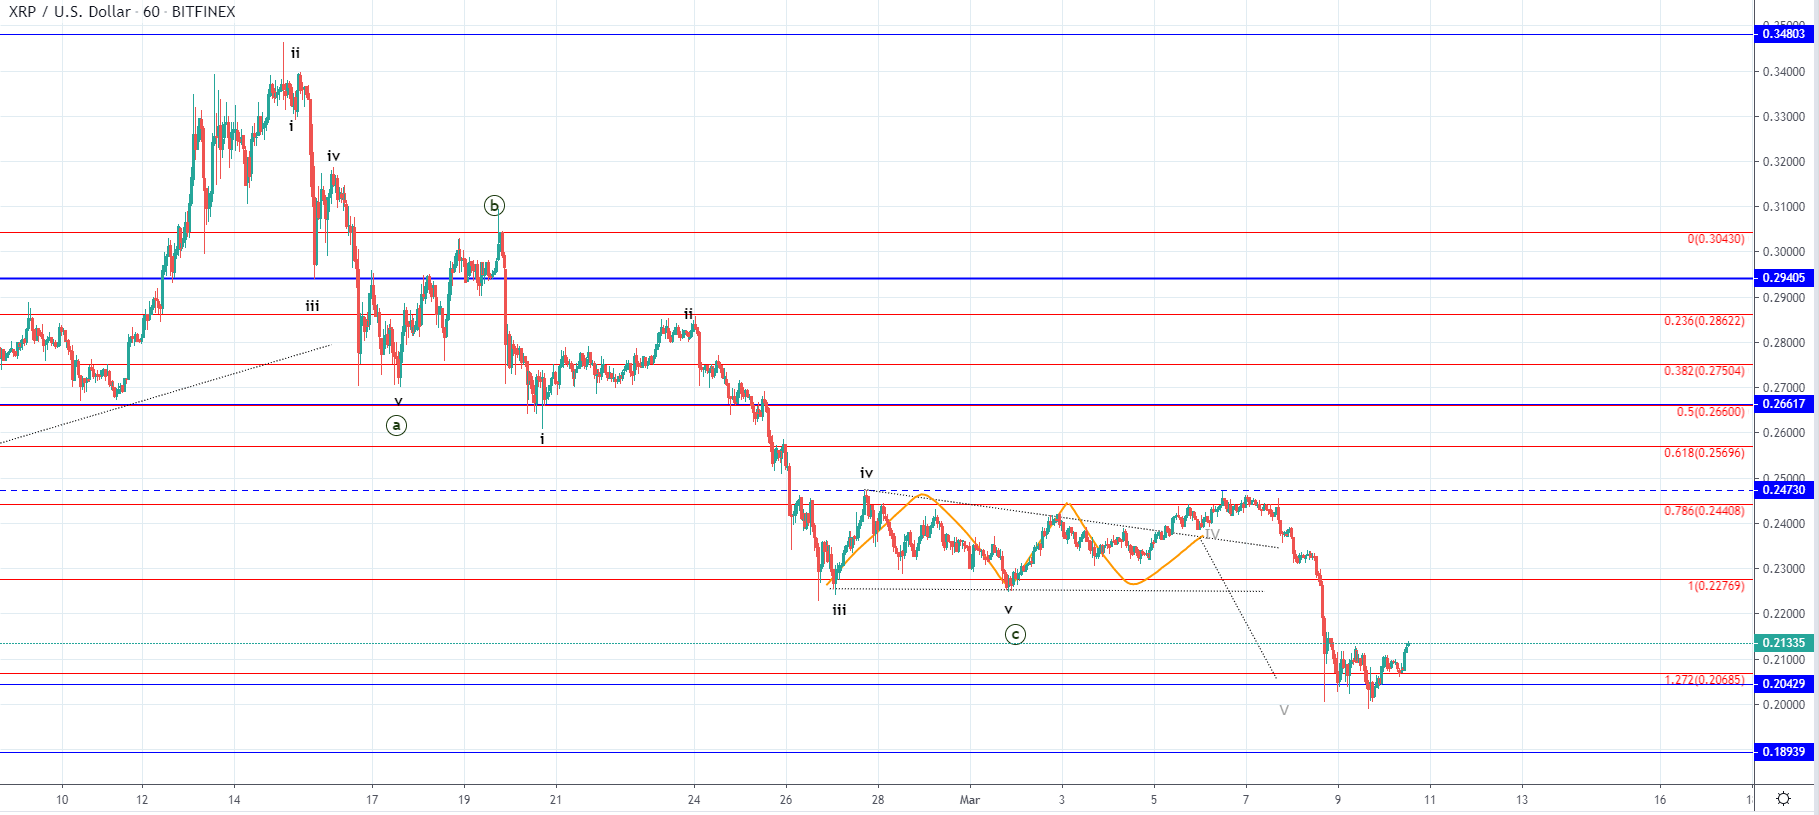
On the hourly chart, we can see that the price came down to my projected target for the main scenario in which the price of Ripple was to end it’s 5th wave out of the five-wave impulse to the downside of a lower degree which is the C wave of the Minute count. An interaction has been made with the 0.2 horizontal level and even a quick dip below it was made but only served to activate the buying as it entered the buyer’s territory.
If the ABC correction ended we are seeing the development of the next move to the upside which could be a five-wave impulse but it is still unclear weather or not it would be the uptrend continuation as the correction ended or would it be a corrective increase.
FXOpen offers the world's most popular cryptocurrency CFDs*, including Bitcoin and Ethereum. Floating spreads, 1:2 leverage — at your service (additional fees may apply). Open your trading account now or learn more about crypto CFD trading with FXOpen.
*Important: At FXOpen UK, Cryptocurrency trading via CFDs is only available to our Professional clients. They are not available for trading by Retail clients. To find out more information about how this may affect you, please get in touch with our team.
This article represents the opinion of the Companies operating under the FXOpen brand only. It is not to be construed as an offer, solicitation, or recommendation with respect to products and services provided by the Companies operating under the FXOpen brand, nor is it to be considered financial advice.
Stay ahead of the market!
Subscribe now to our mailing list and receive the latest market news and insights delivered directly to your inbox.


Latest articles

DAX 40: consolidation amid technology sell-off
A wave of selling in the technology sector that emerged earlier this week has weighed on European equities. The trigger was investor concern over the profitability of large-scale debt-funded investments by major US tech companies in AI infrastructure. The Nasdaq

Euro Hits Fresh Yearly Lows Amid Dovish ECB Signals
The euro remains under pressure following weak macroeconomic data from the euro area and fresh signals that the European Central Bank is prepared to maintain a more accommodative monetary policy stance. Data released yesterday pointed to a deterioration in business

Pound at Key Levels: Markets Assess Impact of Political Uncertainty in the UK
The British pound remains under pressure following increased political uncertainty in the United Kingdom triggered by the Prime Minister’s resignation. Investors are assessing potential shifts in the political and economic policy outlook after the head of government stepped down,