


FXOpen

BTC/USD
From last Monday when the price of Bitcoin was sitting around $9783 at its highest point we have seen a decrease of 9.57% measured to its lowest point made on Saturday at $8847. Since then we have seen a recovery of 3.93% coming to $9221.7 with the price now being traded slightly lower.
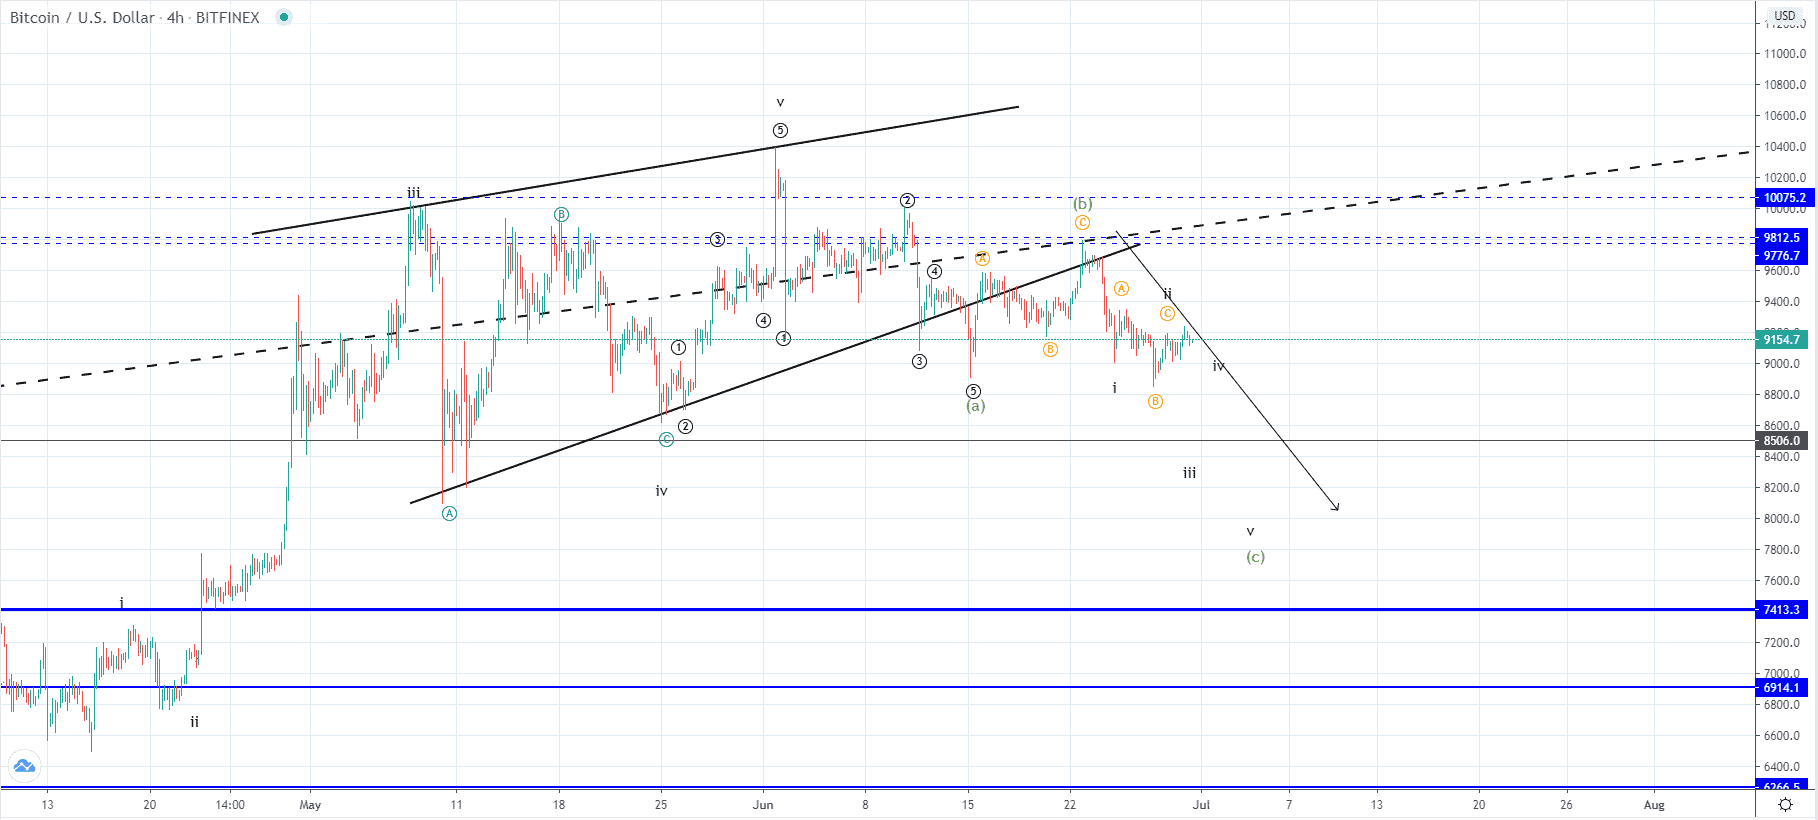
Looking at the hourly chart, you can see that the projection is going in accordance as I have outlined the price pathway in the previous post to be a move to the downside as we have seen a test of the ascending triangle's support level for resistance after a breakout below it. This was appeared to be an ABC correction to the upside which is why now I would be expecting to see another five-wave impulse to the downside which could either be a C wave if this structure is corrective or the 3rd wave if this structure from the 1st of Jun is impulsive.
The price made an interaction with the ascending triangle’s resistance level on the 1st of Jun coming to $10402 at its highest spike after which a downward impulse has been seen below the starting point of the prior upside move which indicated the end of the increase. If this move marked the completion of the higher degree C wave out of the ABC correction that developed since the 16th of March then we are likely seeing the development of a sustainable downtrend out of which the now expected five-wave move would be the 3rd sub-wave of the 1st wave from the higher degree. But in either way from the depth and the momentum from the decline, we are to evaluate this possibility.
XRP/USD
From Saturday’s low at $0.169 the price of Ripple has recovered by 6.26% as it came up to $0.17958 at its highest point but is currently being traded slightly lower as it started finding resistance below the 1.618 Fibonacci level.
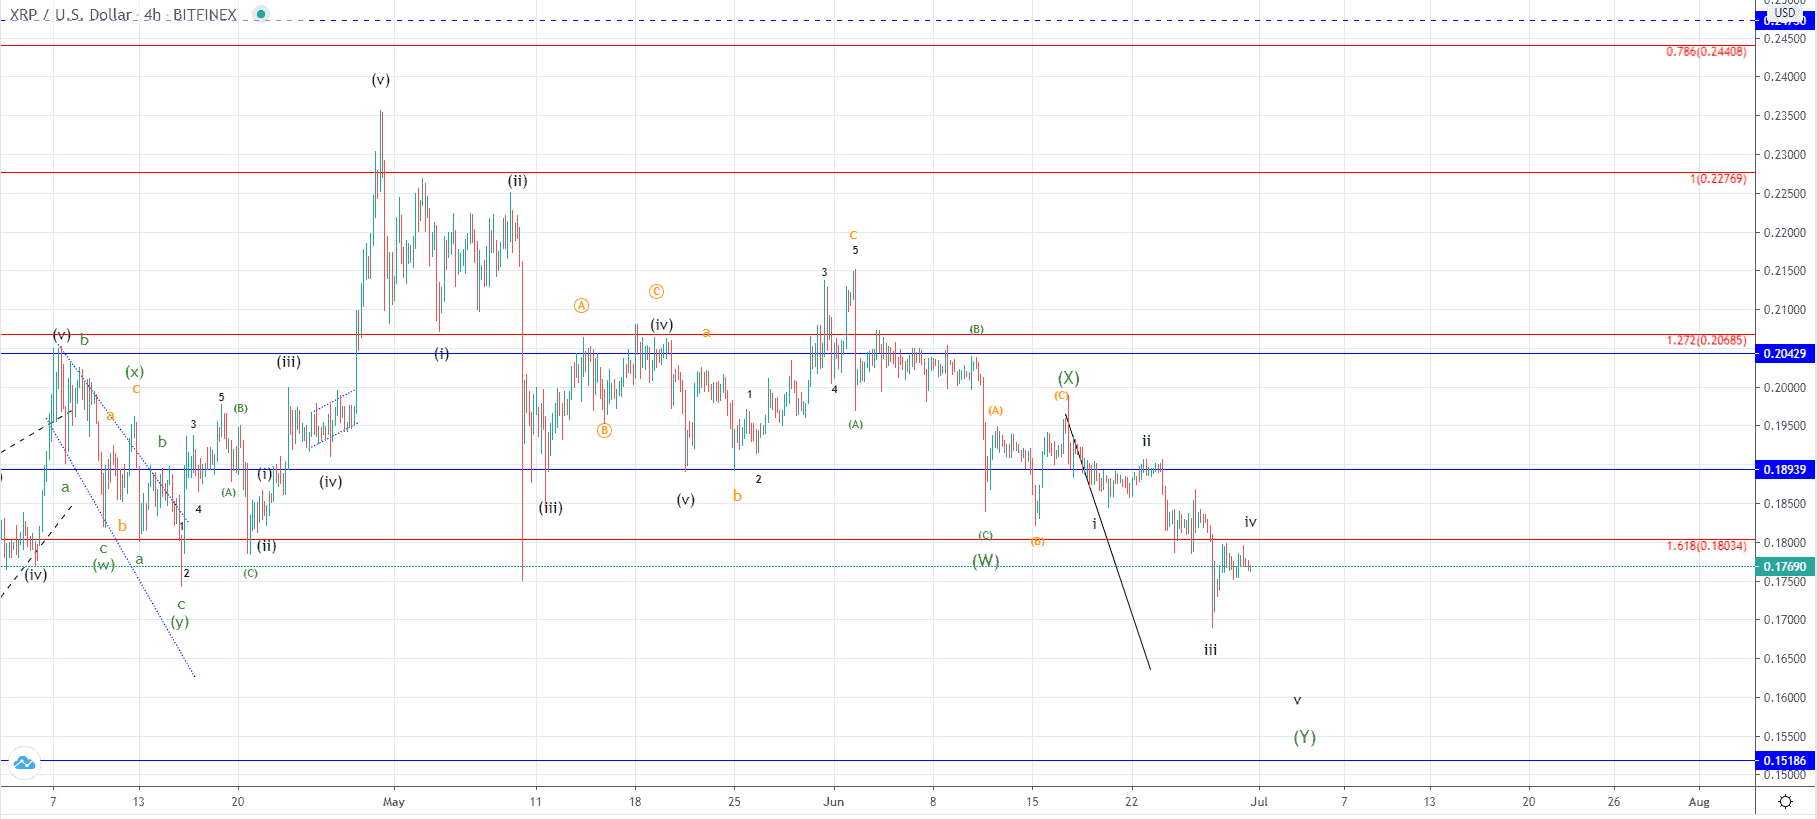 On the hourly chart, you can see that like in the case of Bitcoin further downside movement would be expected from here as we are most likely seeing the development of the higher degree three-wave correction from the 1st of Jun. If this is true then the currently seen descending structure from the 17th is a five-wave impulse and is going to continue forming for another lower low compared to the Saturday’s one.
After the completion of this descending move, we could be seeing a recovery of the same degree but a more longer-term downtrend could also look likely if the corrective WXY count get’s prolonged by two more waves X and Z.
FXOpen offers the world's most popular cryptocurrency CFDs*, including Bitcoin and Ethereum. Floating spreads, 1:2 leverage — at your service. Open your trading account now or learn more about crypto CFD trading with FXOpen.
*At FXOpen UK and FXOpen AU, Cryptocurrency CFDs are only available for trading by those clients categorised as Professional clients under FCA Rules and Professional clients under ASIC Rules respectively. They are not available for trading by Retail clients.
This article represents the opinion of the Companies operating under the FXOpen brand only. It is not to be construed as an offer, solicitation, or recommendation with respect to products and services provided by the Companies operating under the FXOpen brand, nor is it to be considered financial advice.
Stay ahead of the market!
Subscribe now to our mailing list and receive the latest market news and insights delivered directly to your inbox.

Latest articles

Weekly Market Wrap With Gary Thomson: Nasdaq, EUR/USD, USD/CHF, Brent Crude Oil, Googl Shares
Get the latest scoop on the week's hottest headlines, all in one convenient video. Join Gary Thomson, the COO of FXOpen UK, as he breaks down the most significant news reports and shares his expert insights.
- Nasdaq Composite: Worst Session

Analysis of AUD/USD: Exchange Rate Falls to Early May Low
As indicated by the 4-hour AUD/USD chart today:
→ the rate fell below 0.652, a level last seen on May 2;
→ the RSI indicator dropped below 15, a level last seen during the panic over the spread of COVID-19

Analysis of AMZN Stock: Price at 1.5-Month Low
As shown in the AMZN chart, the stock price dropped below:
→ the psychological level of $180;
→ the mid-June interim low.
The last time AMZN traded below $180 was in early June.
Thus, AMZN has faced sell-offs, similar to other tech