


FXOpen
BTC/USD
From its all-time high at $58,360, the price of Bitcoin has made a decrease of 22.8% today as it fell to $45,058 at its lowest spike. Currently, it is being traded at $47,251 and the price is in a steep downward trajectory.
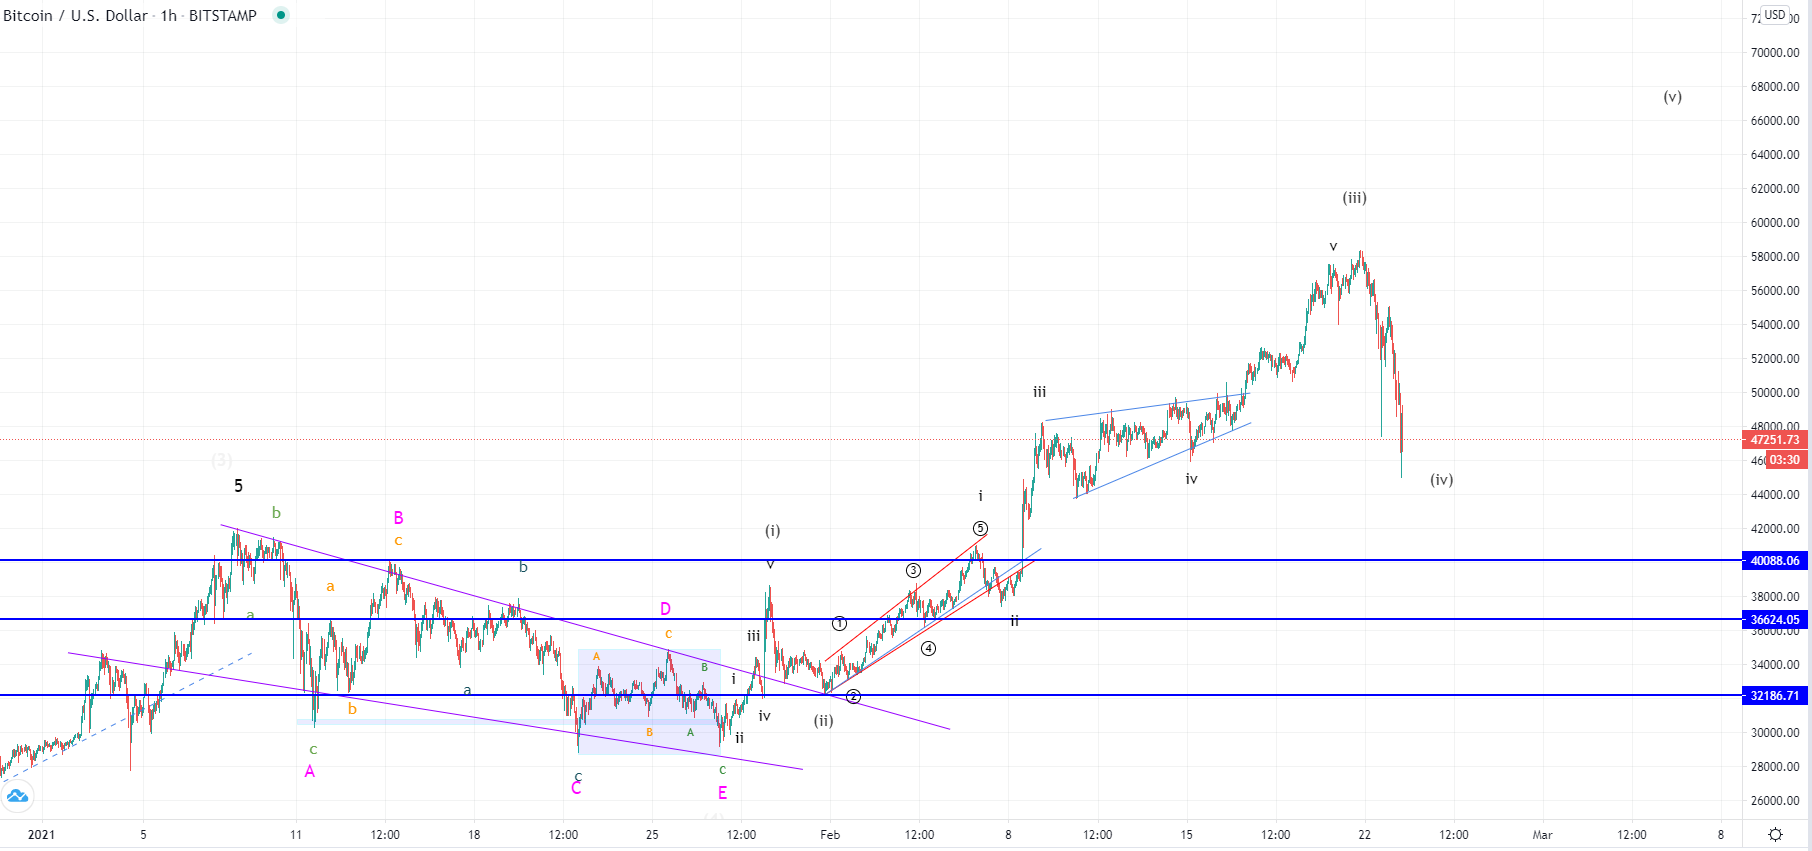
Looking at the hourly chart, we can see that the price ended its 3rd wave out of the impulse that started on the 27th of January. This is why the seen decrease is still considered correctional in nature but is still unclear where this downfall could end. If this is the developing 4th wave would have seen its first sub-wave which is why now a short-term recovery would be expected.
But after a short-term recovery, we can see its 3rd sub-wave making a lower low, potentially somewhere around its all-time high of $40,000. But if the price goes to those levels it could indicate the possibility that the upward move has ended altogheter. If this is true then we have seen the completion of the five-wave impulse at the $58,000 area in which case now a longer-term correction could play out.
For the signs of confirmation, we are going to look at what happens at the current levels as if this is the 4th wave the price should start an immediate recovery. But if it continues moving to the downside further in a straight line the second scenario would look more likely.
XRP/USD
The price of Ripple has been in a downfall as well and made a decrease of 43.52% measured from its recent high at $0.65 to its lowest point today at $0.3668. Since then it made a minor recovery and is currently sitting at $0.44278 level.

On the hourly chart, you can see that the price made it below the significant horizontal range between $0.5 and $0.47. This was a significant pivot zone that served as an indication of whether or not the prior ascending move was impulsive or corrective.
As a breakout was made the correctness was confirmed which is why now further downside would be expected. The price is likely to continue decreasing below its prior correctional move made on the 2nd of February when it came down to $0.34. If this is the 3rd sub-wave from the correction that started on the 1st of February then the price is going to form a five-wave impulse that is going to be the C wave of the higher degree count. This in turn means that the price of Ripple is set for an uptrend continuation after it ends but first it needs to establish some firm support.
This forecast represents FXOpen Markets Limited opinion only, it should not be construed as an offer, invitation or recommendation in respect to FXOpen Markets Limited products and services or as financial advice.
Cryptocurrency CFDs are not available to trade in all jurisdictions.
FXOpen offers the world's most popular cryptocurrency CFDs*, including Bitcoin and Ethereum. Floating spreads, 1:2 leverage — at your service. Open your trading account now or learn more about crypto CFD trading with FXOpen.
*At FXOpen UK and FXOpen AU, Cryptocurrency CFDs are only available for trading by those clients categorised as Professional clients under FCA Rules and Professional clients under ASIC Rules respectively. They are not available for trading by Retail clients.
This article represents the opinion of the Companies operating under the FXOpen brand only. It is not to be construed as an offer, solicitation, or recommendation with respect to products and services provided by the Companies operating under the FXOpen brand, nor is it to be considered financial advice.
Stay ahead of the market!
Subscribe now to our mailing list and receive the latest market news and insights delivered directly to your inbox.

Latest articles

Weekly Market Wrap With Gary Thomson: Nasdaq, EUR/USD, USD/CHF, Brent Crude Oil, Googl Shares
Get the latest scoop on the week's hottest headlines, all in one convenient video. Join Gary Thomson, the COO of FXOpen UK, as he breaks down the most significant news reports and shares his expert insights.
- Nasdaq Composite: Worst Session

Analysis of AUD/USD: Exchange Rate Falls to Early May Low
As indicated by the 4-hour AUD/USD chart today:
→ the rate fell below 0.652, a level last seen on May 2;
→ the RSI indicator dropped below 15, a level last seen during the panic over the spread of COVID-19

Analysis of AMZN Stock: Price at 1.5-Month Low
As shown in the AMZN chart, the stock price dropped below:
→ the psychological level of $180;
→ the mid-June interim low.
The last time AMZN traded below $180 was in early June.
Thus, AMZN has faced sell-offs, similar to other tech