


FXOpen
BTC/USD
From last Thursday when the price of Bitcoin fell down to around $11200 level which was the lowest price has been since the 12th of August, we have seen an increase of 6.83% as the price came up to $11967 at its highest point today at which its currently being traded. The price is in an upward trajectory and is showing strong bullish momentum.
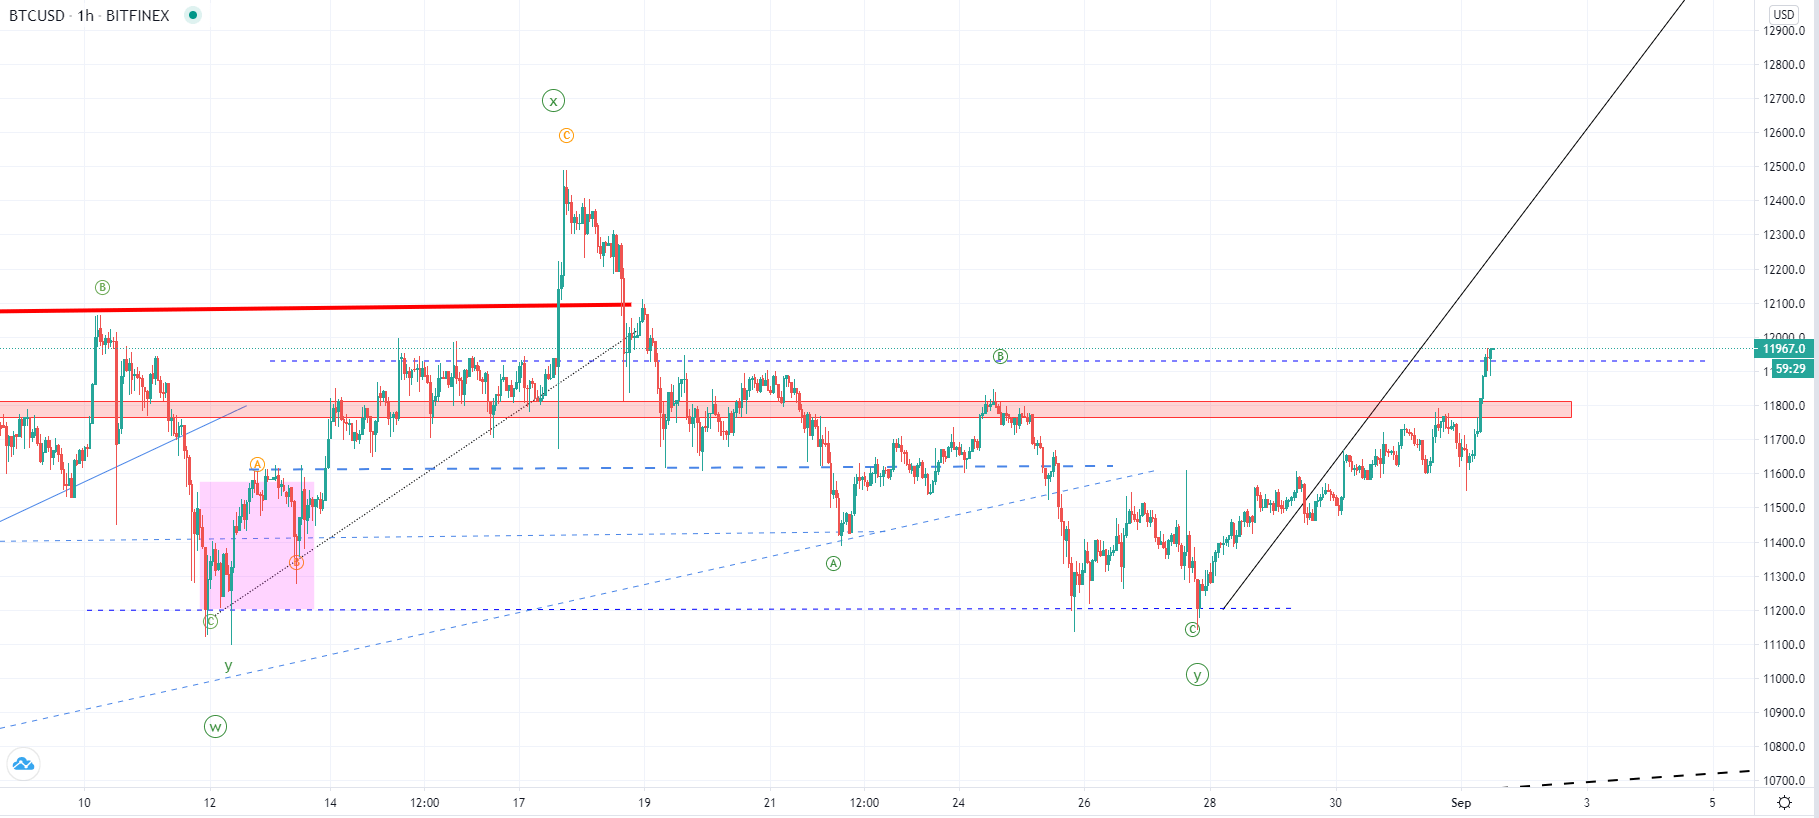
On the hourly chart, you can see that the price broke out from the major horizontal resistance points and isn’t showing any signs of struggle with the last rise from today’s low at $11551 being parabolic. With the price making a higher high compared to the previous B wave of the lower degree ABC correction to the downside we are most likely seeing the beginning of the higher degree upside move after the WXY correction ended last week.
Another possibility could be that this upward move is another corrective second wave X from the prolonged correction count WXYXZ but considering the bullish momentum seen this isn’t as likely. This will shortly be validated by the interaction with the $12000 area with whom the interaction is very close.
If we see a breakout above it, even though a fakeout was seen on the 17th of August it would be a clear indication that another upward move has started that is to lead the price of Bitcoin into the $13500 zone.
XRP/USD
The price of Ripple has increased by 15.7% from last week’s low at $0.25491 as it came up to $0.29485 at its highest point slightly below which its currently being traded. Unlike in the case of Bitcoin we have seen the price making a minor pullback after reaching its first significant horizontal resistance level.
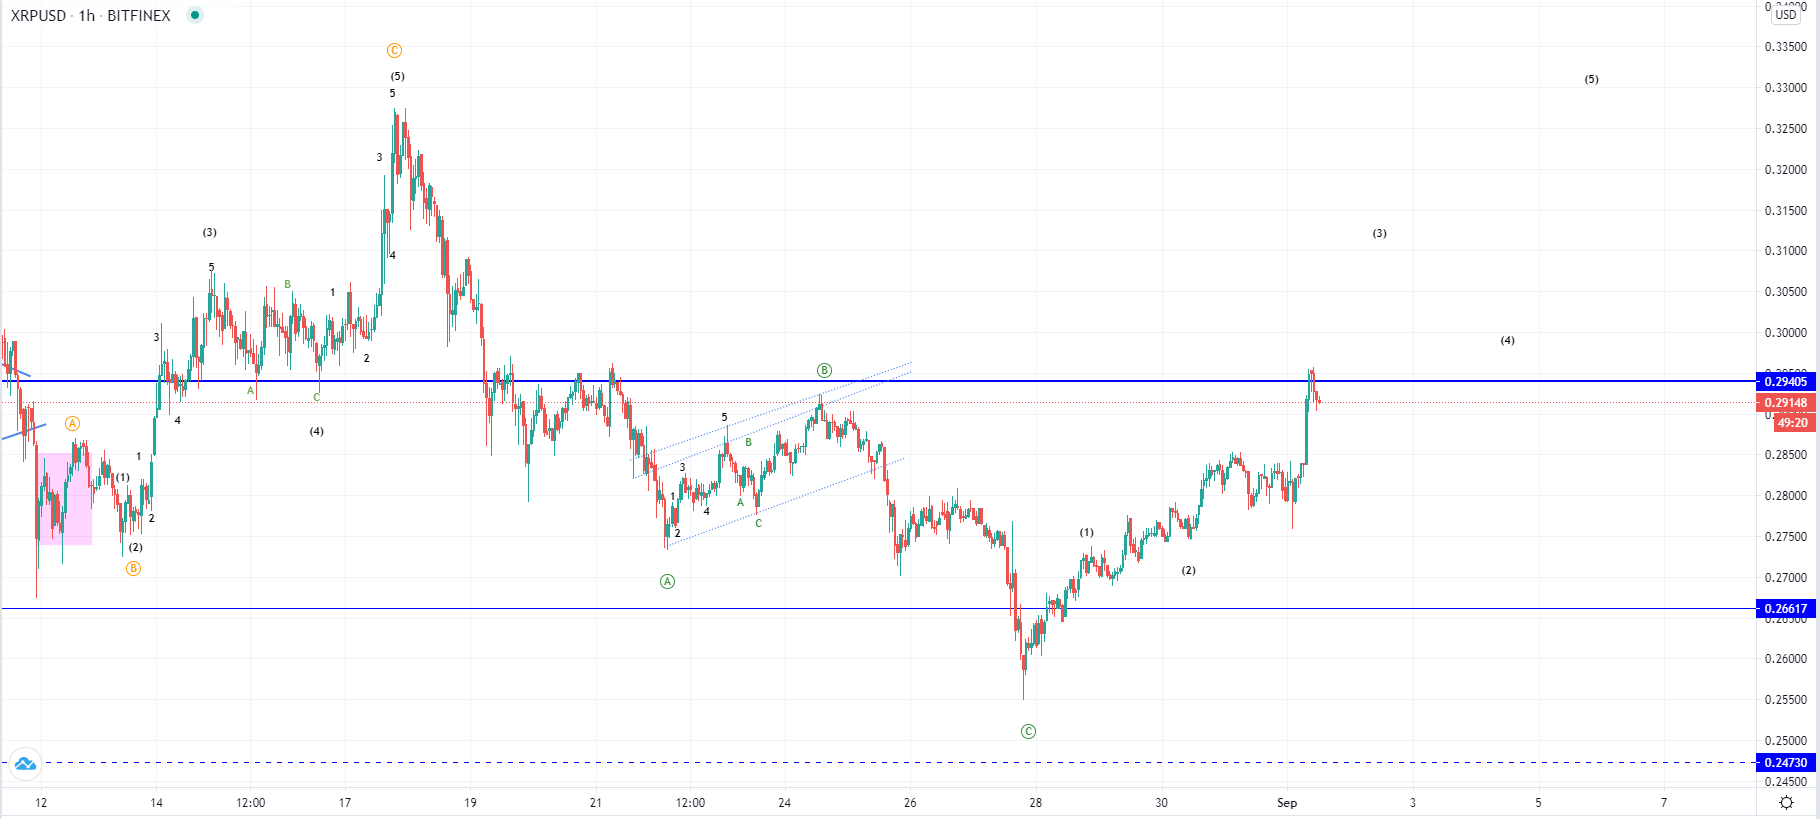
Looking at the hourly chart, you can see that after the price made an interaction with the horizontal level at $0.29405 it found resistance there and has started to decrease but not by a significant amount as the bullish momentum is holding the sellers in check. The price is resting on the minor horizontal support which is an early indication that the increase is likely to continue for a breakout to the upside above the significant level.
If we have seen the completion of the ABC correction last Thursday then the currently seen upside move is the 3rd wave of the five-wave move to the upside which is the 1st sub-wave of the higher degree count and is likely to end as a retest of the $0.33 area where the last upside move ended and found resistance there.
FXOpen offers the world's most popular cryptocurrency CFDs*, including Bitcoin and Ethereum. Floating spreads, 1:2 leverage — at your service. Open your trading account now or learn more about crypto CFD trading with FXOpen.
*At FXOpen UK and FXOpen AU, Cryptocurrency CFDs are only available for trading by those clients categorised as Professional clients under FCA Rules and Professional clients under ASIC Rules respectively. They are not available for trading by Retail clients.
This article represents the opinion of the Companies operating under the FXOpen brand only. It is not to be construed as an offer, solicitation, or recommendation with respect to products and services provided by the Companies operating under the FXOpen brand, nor is it to be considered financial advice.
Stay ahead of the market!
Subscribe now to our mailing list and receive the latest market news and insights delivered directly to your inbox.

Latest articles

Weekly Market Wrap With Gary Thomson: Nasdaq, EUR/USD, USD/CHF, Brent Crude Oil, Googl Shares
Get the latest scoop on the week's hottest headlines, all in one convenient video. Join Gary Thomson, the COO of FXOpen UK, as he breaks down the most significant news reports and shares his expert insights.
- Nasdaq Composite: Worst Session

Analysis of AUD/USD: Exchange Rate Falls to Early May Low
As indicated by the 4-hour AUD/USD chart today:
→ the rate fell below 0.652, a level last seen on May 2;
→ the RSI indicator dropped below 15, a level last seen during the panic over the spread of COVID-19

Analysis of AMZN Stock: Price at 1.5-Month Low
As shown in the AMZN chart, the stock price dropped below:
→ the psychological level of $180;
→ the mid-June interim low.
The last time AMZN traded below $180 was in early June.
Thus, AMZN has faced sell-offs, similar to other tech