


BTC and XRP - Downtrend likely to continue.
FXOpen
BTC/USD
From last Thursday the price of Bitcoin has recovered by 13.41% as it came up from $9655 to $10950 at its highest point today. The price is currently being traded slightly lower as it reached close to its significant horizontal resistance level at around 0.382 Fib level which is why a minor retracement occurred.
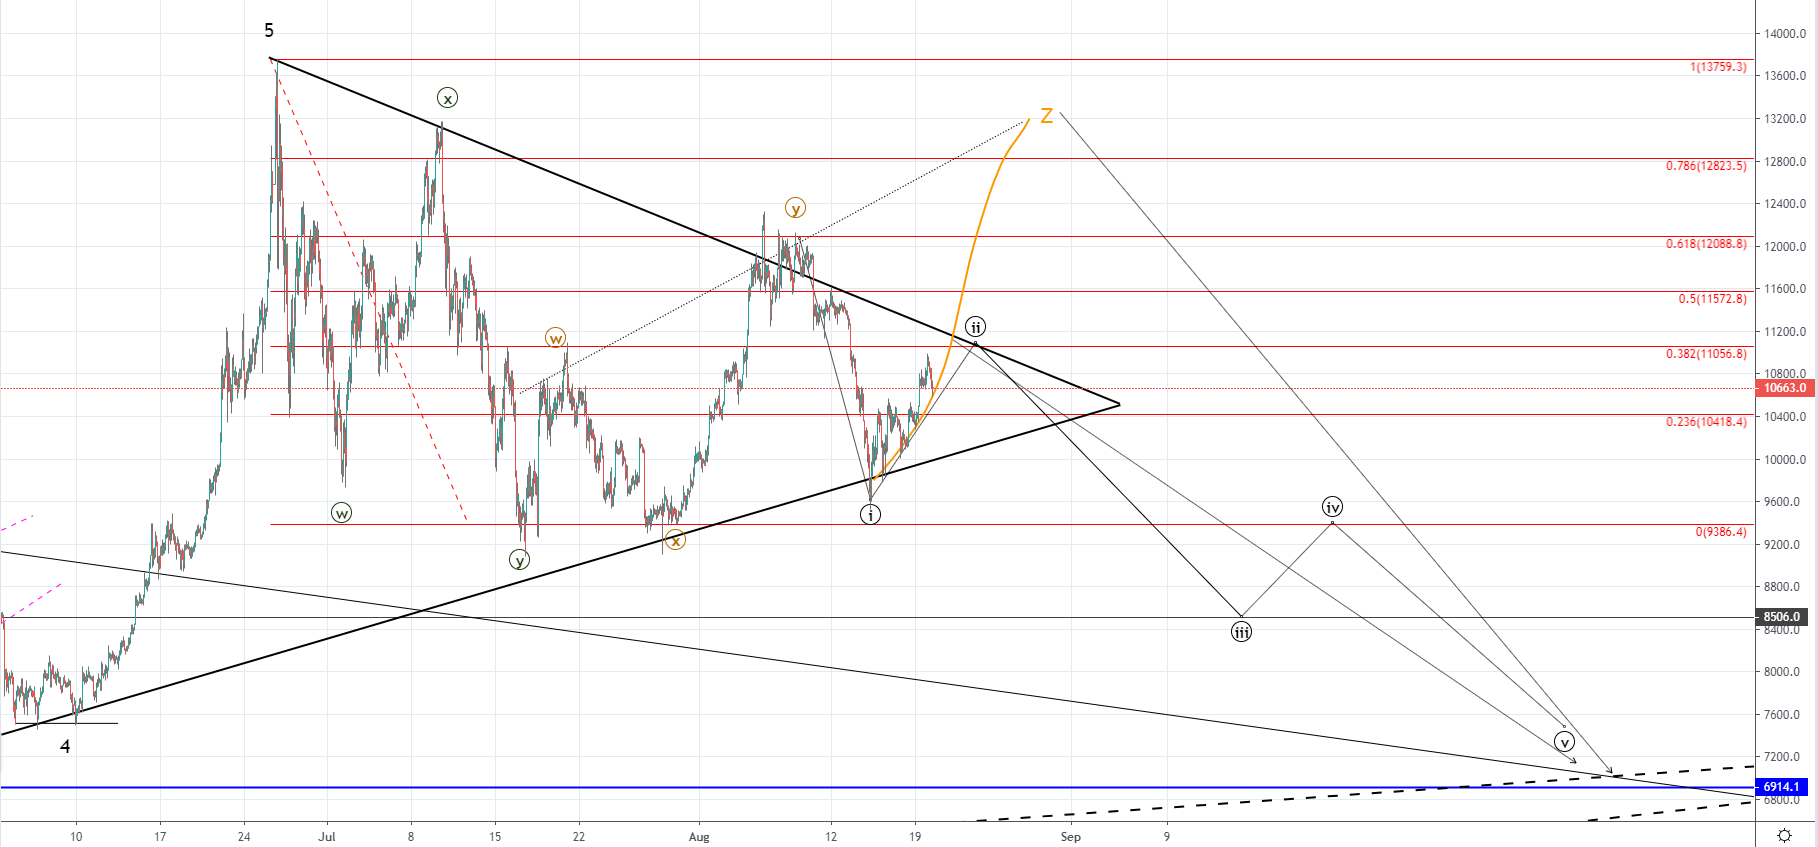 On the hourly chart, you can see that the price has found support on the symmetrical triangle which could be interpreted as a bearish pennant which is why the recovery has been made but there isn’t much further room left before we see a breakout from the triangle. From the yearly high we’ve seen a three-wave move to the downside after which a three-wave recovery has developed. The uptrend continuation has been invalidated when the price of Bitcoin fell below the second W wave’s ending point which was presumed the be the territory of the 2nd wave in which the price cannot enter on the 4th if impulsive.
As the downfall from the second upward WXY correction made a higher low we are still seeing the triangle pattern getting respected but the current recovery may also be corrective in nature which is why I would be anticipating a breakout to the downside in a five-wave manner. There is a possibility that we are to see a breakout to the upside from the symmetrical triangle in which case the WXY correction would get prolonged by two more waves and would mean that the previous downfall was the second X wave from the WXYXZ corrective count. But in either way I would be expecting the price of Bitcoin to be headed toward the $7000 area where multiple support points intersection is.
XRP/USD
Last week on Wednesday the price of Ripple has broken its significant horizontal support level at $0.29405 and continued moving past the next one at $0.26617, reaching $0.25503 at its lowest on Thursday. From there we’ve seen a recovery of 15% until Sunday when a retest of the broken support level has been made, but as the interaction ended as a rejection another downturn occurred with the price currently trading at $0.27391.
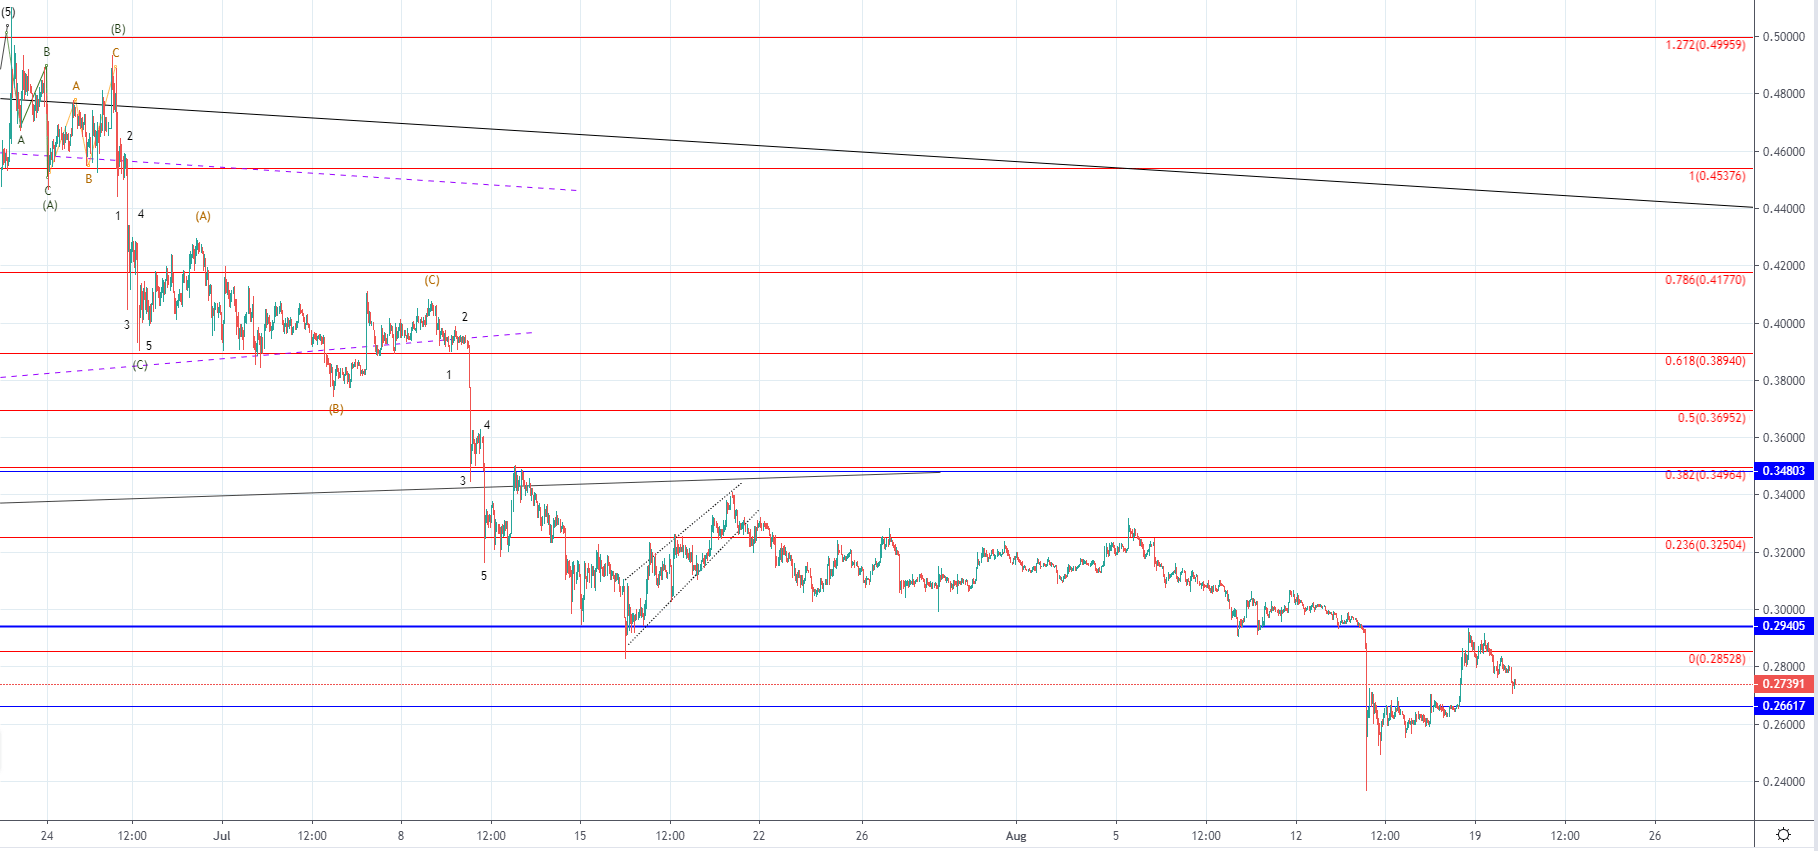 On the hourly chart, you can see that the price of Ripple is stuck in another horizontal range below the previous one but above the lower horizontal support level which didn’t prove to serve as a significant one. This is why believe that the rejection occurred at the significant one is to lead the price of Ripple lower but another retest might occur before another downturn starts. If the price manages to come back above the horizontal level it could mean that the downfall was overextended as the price of Ripple decreased by 49% from its recent high slightly below $0.5 level.
There aren’t any clear signs of the bullish interest just yet with is why for now the downtrend continuation looks more likely but if this changes over the course of the next couple of days it could set the price of Ripple into a significant recovery potentially reaching the 0.618 Fib level again.
FXOpen offers the world's most popular cryptocurrency CFDs*, including Bitcoin and Ethereum. Floating spreads, 1:2 leverage — at your service (additional fees may apply). Open your trading account now or learn more about crypto CFD trading with FXOpen.
*Important: At FXOpen UK, Cryptocurrency trading via CFDs is only available to our Professional clients. They are not available for trading by Retail clients. To find out more information about how this may affect you, please get in touch with our team.
This article represents the opinion of the Companies operating under the FXOpen brand only. It is not to be construed as an offer, solicitation, or recommendation with respect to products and services provided by the Companies operating under the FXOpen brand, nor is it to be considered financial advice.
Stay ahead of the market!
Subscribe now to our mailing list and receive the latest market news and insights delivered directly to your inbox.


Latest articles

Apple: Earnings Day Above the Activity Zone
On 30 April, after the market close, Apple Inc. will release its financial results for the second quarter of fiscal 2026. The consensus forecast, based on estimates from 31 analysts, points to revenue of around $109.7 billion, with expected

USD/JPY and USD/CHF Near Key Levels: The Dollar Supported by the Fed
The US dollar continues to trend upwards following the Federal Reserve meeting, drawing support from the regulator’s moderately hawkish stance and comments by Jerome Powell. Markets interpret the Fed’s rhetoric as a signal that restrictive policy is likely

EUR/USD and GBP/USD consolidate ahead of the Fed decision
European currencies are showing subdued dynamics, entering a consolidation phase following their previous advance. Earlier, EUR/USD and GBP/USD broke out of their ranges and strengthened; however, the subsequent correction has led both pairs to retest the previously breached