


BTC and XRP - Establishing Support
FXOpen

BTC/USD
The price of Bitcoin has been increasing since last Thursday when it was sitting at $10539.2 and from there reached $11742 at its highest yesterday which was an increase of 11.42%. From yesterday’s high the price pulled back by 2.6% and is currently being traded at around $11500 level.
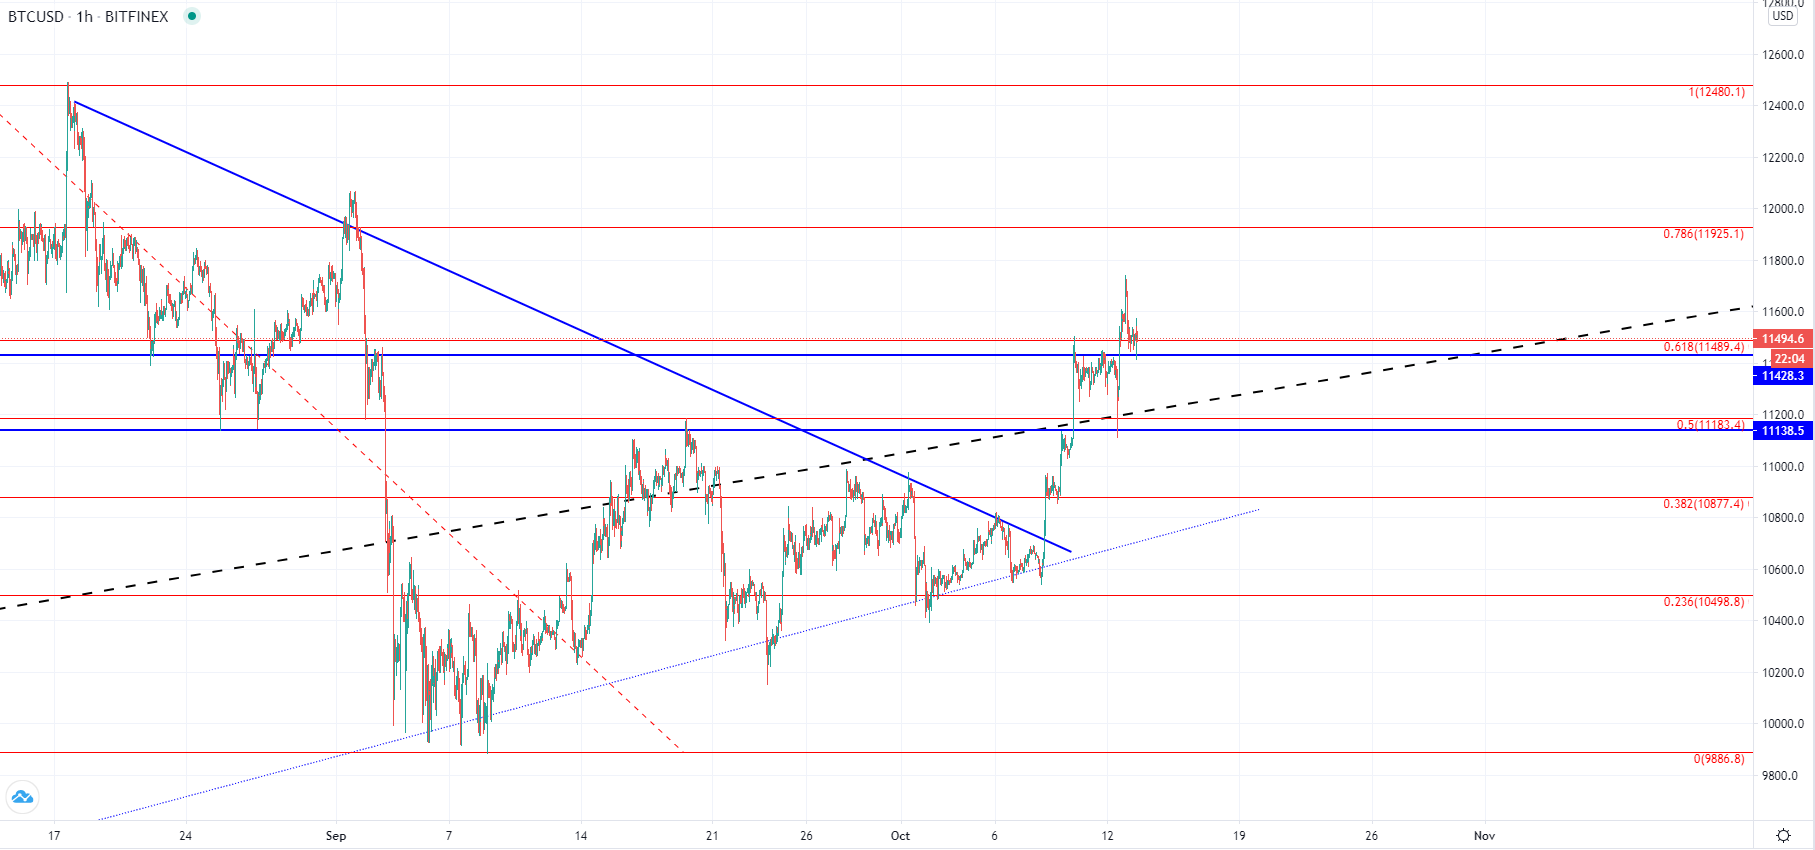
On the hourly chart, we can see that last Thursday a breakout was made from the symmetrical triangle in which it was since the yearly high was made and the bullish momentum pushed the price above two significant horizontal levels at $11138.5 and the next one at $11428.3. The upper significant horizontal level correlates with the 0.618 Fibonacci one that is currently being tested for support.
As the price broke out into the upper range and is establishing support on its horizontal level further upside would be expected. First, a validation of the support level is needed and is likely going to occur in the current test. If not the price could go back down to the interrupted ascending trendline for another restest after it found support there on yesterday’s pullback.
The breakout that occurred from Thursday is most likely the continuation of the upward movement that is to propel the price of Bitcoin above $12000 area but first a revisit at those levels will tell us how much more room the price has to the upside.
XRP/USD
The price of Ripple has been following a similar pattern as from last Thursday when it was sitting at $0.2427 made an increase of 7.34% coming to $0.26 at its highest point. Now the price is being traded at around $0.2569 level and has started moving sideways after a third revisit to the $0.26 resistance zone.
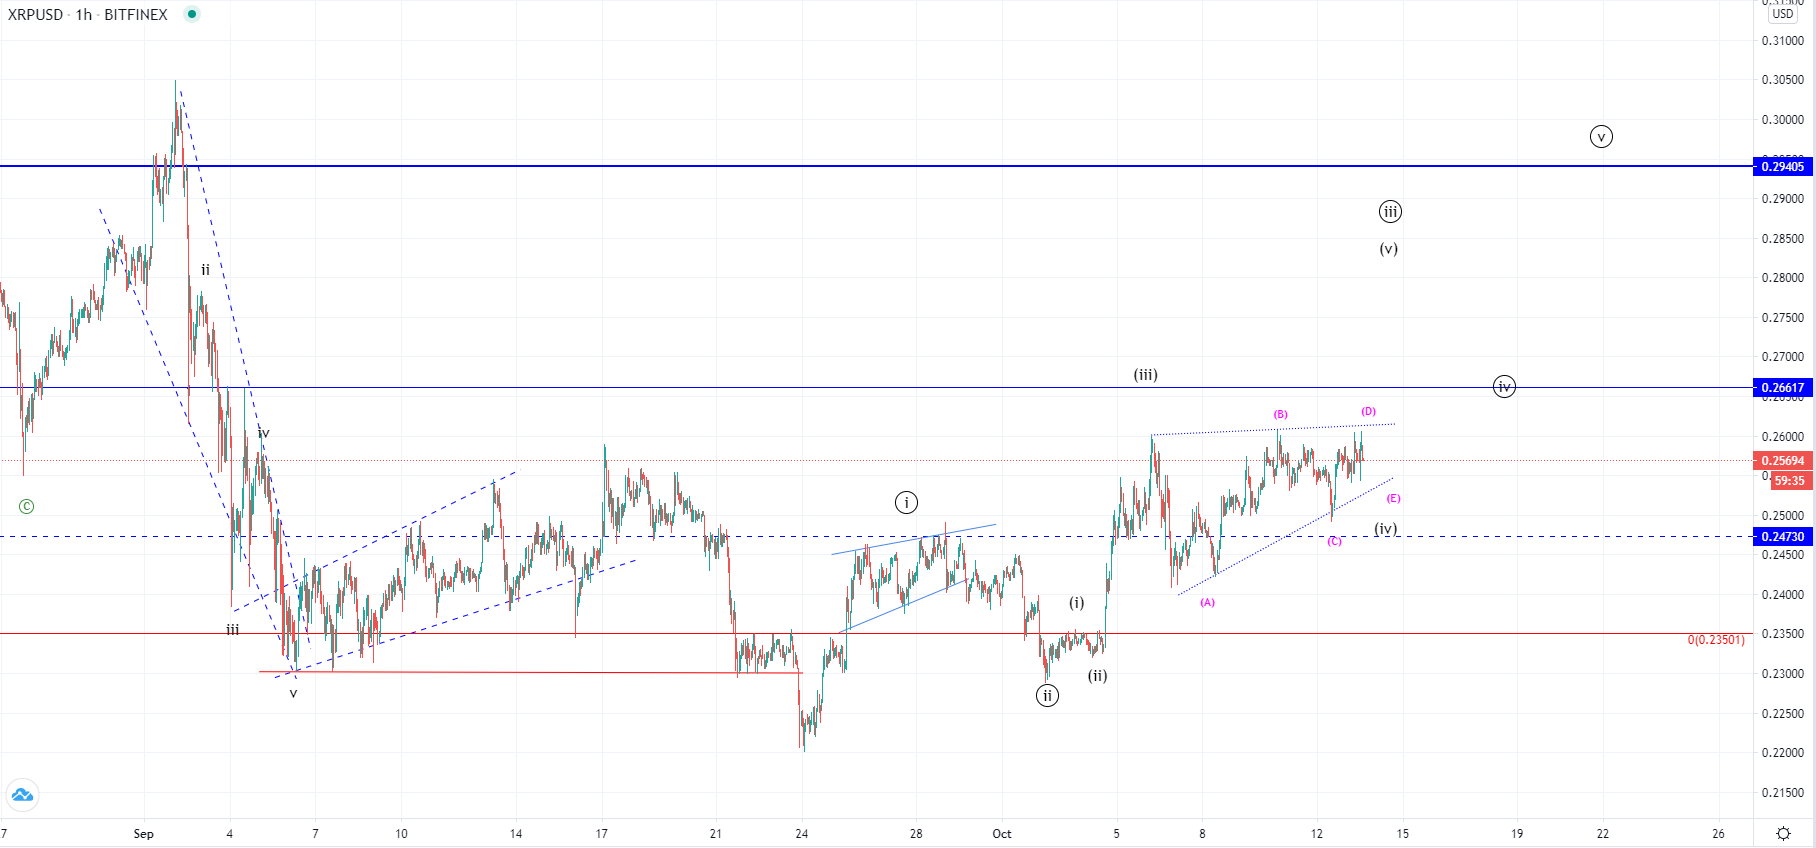
On the hourly chart, we can see that unlike in the case of Bitcoin the price of Ripple made a higher low on the 2nd of October after it came down to $0.22 on the 24th of September. This is when the upward movement started unlike in the case of Bitcoin whose price started showing bullish signs after the 7th of September. The price continued its increase above $0.2473 which was a significant horizontal resistance after the September 24th low.
As we have seen the increase continuing it reached another significant horizontal resistance at the prior higher high made on the 17th of September after which a correctional structure has started developing. Now we are most likely seeing a consolidative correctional move inside a triangle which is set to bring the price of Ripple for another retest of its ascending trendline before a breakout to the upside would be made above the $0.26 resistance zone.
FXOpen offers the world's most popular cryptocurrency CFDs*, including Bitcoin and Ethereum. Floating spreads, 1:2 leverage — at your service (additional fees may apply). Open your trading account now or learn more about crypto CFD trading with FXOpen.
*Important: At FXOpen UK, Cryptocurrency trading via CFDs is only available to our Professional clients. They are not available for trading by Retail clients. To find out more information about how this may affect you, please get in touch with our team.
This article represents the opinion of the Companies operating under the FXOpen brand only. It is not to be construed as an offer, solicitation, or recommendation with respect to products and services provided by the Companies operating under the FXOpen brand, nor is it to be considered financial advice.
Stay ahead of the market!
Subscribe now to our mailing list and receive the latest market news and insights delivered directly to your inbox.


Latest articles

US Dollar Strengthens Amid Equity Market Weakness and Hawkish Fed Rhetoric
The US dollar continues to hold firm near multi-year highs as sentiment across equity markets deteriorates and investors increasingly expect the Federal Reserve to maintain a restrictive monetary policy stance for longer. The US economy remains resilient, while inflation risks

Bitcoin: Corrective Channel Broken as Traders Turn More Active
Bitcoin has come under the influence of several factors simultaneously. The wave of selling at the beginning of June was linked to Strategy's first disclosed Bitcoin sale in several years, a prolonged series of outflows from spot ETFs, and a

DAX 40: consolidation amid technology sell-off
A wave of selling in the technology sector that emerged earlier this week has weighed on European equities. The trigger was investor concern over the profitability of large-scale debt-funded investments by major US tech companies in AI infrastructure. The Nasdaq