


BTC and XRP - Further downside expected
FXOpen

BTC/USD
The price of Bitcoin has been in a decline since last Thursday when it came up to $10466 at it’s highest point. From there we have seen a decrease of 8.8% as it came down to $9546 at it’s lowest point yesterday. Currently, the price is being traded slightly higher than yesterday and is sitting at $9705.
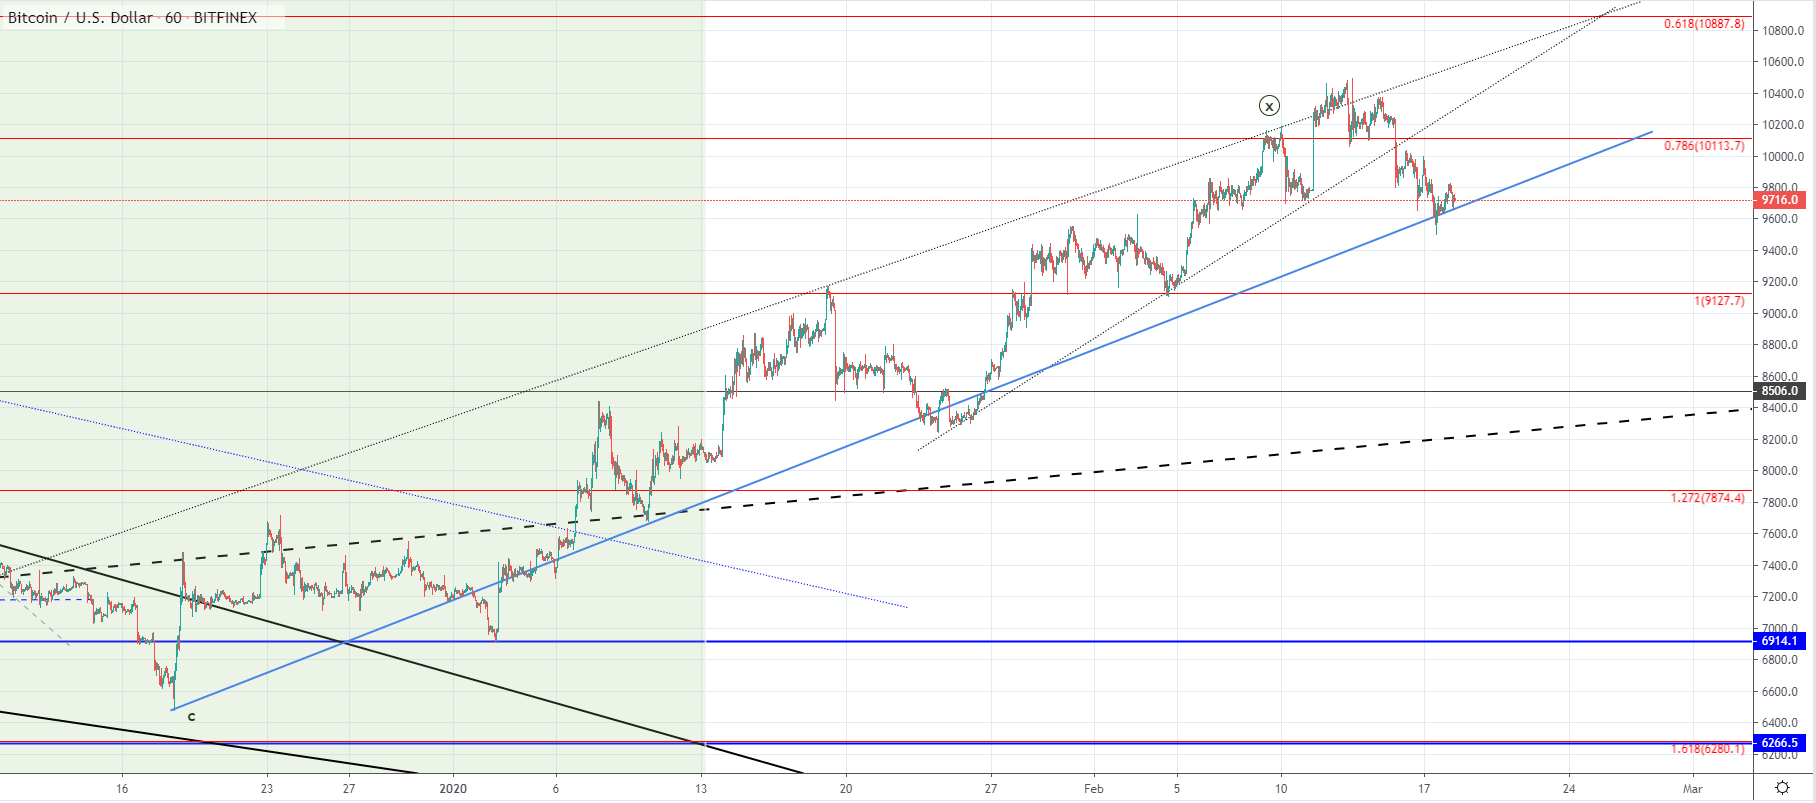 On the hourly chart, we can see that the price came down to retest the ascending trendline from the start of the increase last year in December and has found support there. As we have seen a bounce off of the trendline the currently seen move is most likely further retest of its support so further testing would be expected to occur.
The price broke the upper interrupted ascending trendline with strong bearish momentum which indicated the start of the correction of the same degree but it is still unclear whether or not the expected move to the downside has started. Until the price breaks the current level to the downside we can’t say for sure that the move to the downside has started although the previous breakout is providing an early indication.
The move to the downside which is expected to start would be the retracement to some of the significant support levels potentially at around $8500, especially if we are seeing the development of the next uptrend move. Another possibility would be that the increase seen from December last year is corrective in nature in which case they move to the downside would be the downtrend continuation move but for this, we are yet to receive confirmation.
XRP/USD
The price of Ripple has decreased more compared to the price of Bitcoin as it came down by 19.73% from Saturday’s high at $0.33982 until yesterday’s low at $0.27 but managed to recover by 8.51% since then and came up to $0.29338 at it’s highest point today. At the moment the price is being traded at $0.2844 and is struggling to stay above it’s significant horizontal support level.
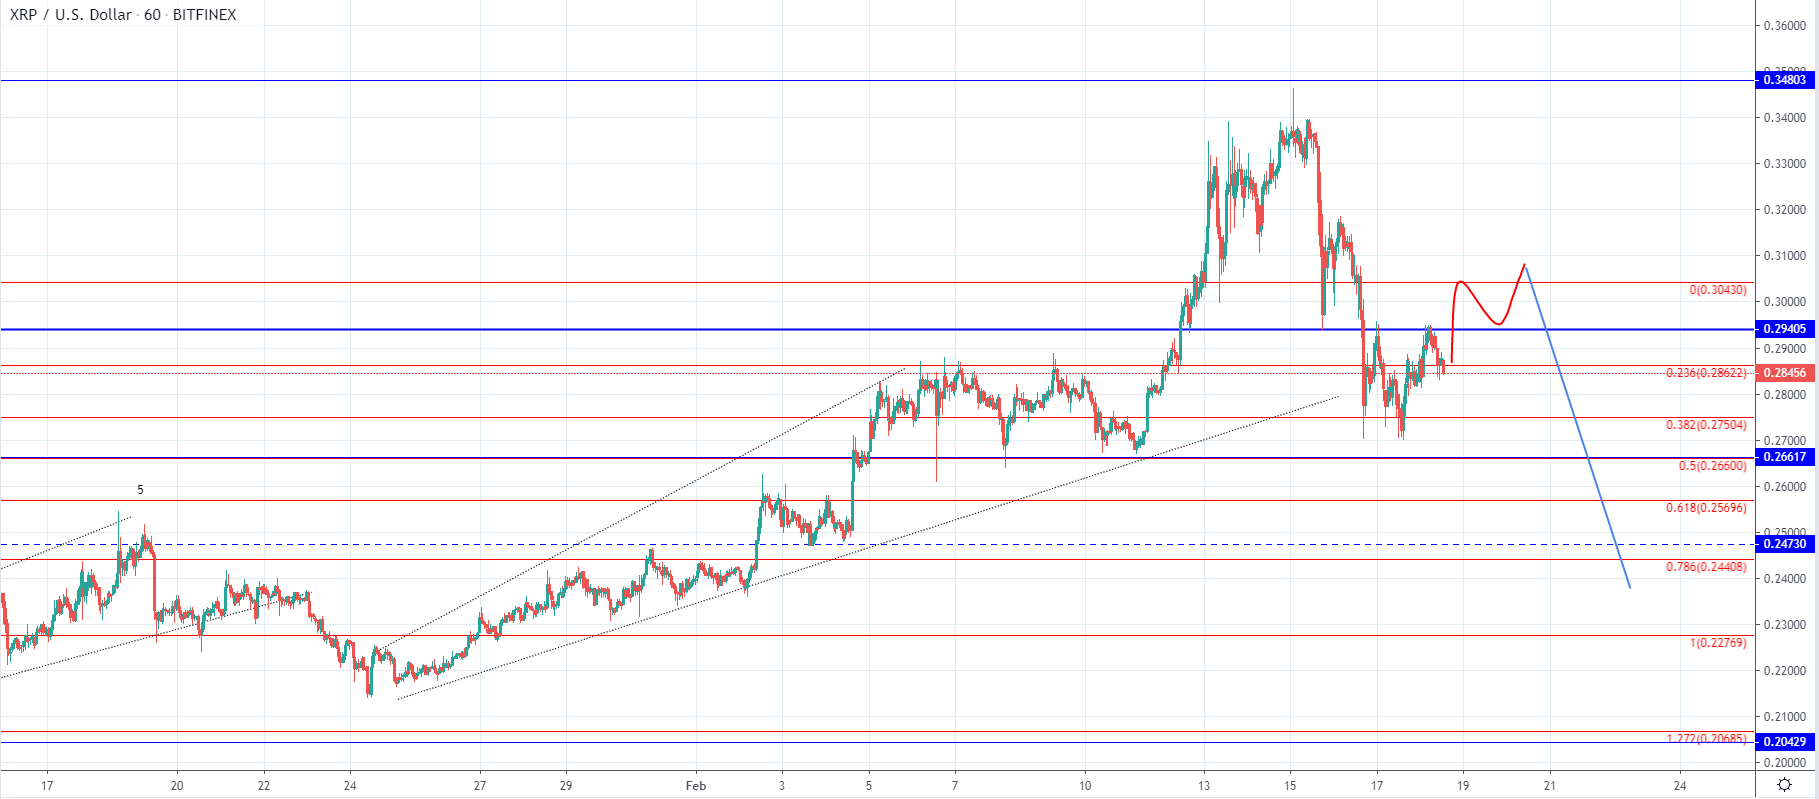 As you can see from the hourly chart, the price came up to the significant horizontal resistance at $0.29405 and got rejected there which is why we have seen a retracement back to the first Fibonacci level in line to the downside but the rejection momentum is still pushing the price further down. If this trend continues the price is likely to be headed down to the next Fib level in line which would push the price into a $0.275 range.
As we have seen a sharp impulsive decline the current move is considered corrective in nature and is most likely the 2nd wave out of the ABC correction which started as the impulsive move to the upside ended. This is why I would be expecting further corrective increase potentially to the 0 Fib level after which a rejection that would occur is to push the price significantly lower as the C wave should develop.
FXOpen offers the world's most popular cryptocurrency CFDs*, including Bitcoin and Ethereum. Floating spreads, 1:2 leverage — at your service (additional fees may apply). Open your trading account now or learn more about crypto CFD trading with FXOpen.
*Important: At FXOpen UK, Cryptocurrency trading via CFDs is only available to our Professional clients. They are not available for trading by Retail clients. To find out more information about how this may affect you, please get in touch with our team.
This article represents the opinion of the Companies operating under the FXOpen brand only. It is not to be construed as an offer, solicitation, or recommendation with respect to products and services provided by the Companies operating under the FXOpen brand, nor is it to be considered financial advice.
Stay ahead of the market!
Subscribe now to our mailing list and receive the latest market news and insights delivered directly to your inbox.


Latest articles

Apple: Earnings Day Above the Activity Zone
On 30 April, after the market close, Apple Inc. will release its financial results for the second quarter of fiscal 2026. The consensus forecast, based on estimates from 31 analysts, points to revenue of around $109.7 billion, with expected

USD/JPY and USD/CHF Near Key Levels: The Dollar Supported by the Fed
The US dollar continues to trend upwards following the Federal Reserve meeting, drawing support from the regulator’s moderately hawkish stance and comments by Jerome Powell. Markets interpret the Fed’s rhetoric as a signal that restrictive policy is likely

EUR/USD and GBP/USD consolidate ahead of the Fed decision
European currencies are showing subdued dynamics, entering a consolidation phase following their previous advance. Earlier, EUR/USD and GBP/USD broke out of their ranges and strengthened; however, the subsequent correction has led both pairs to retest the previously breached