


BTC and XRP - Has the correction ended? March 2020
FXOpen

BTC/USD
From Sunday when the price of Bitcoin retested the $8506 level and found support there we have seen an increase of 5.8% measured to its highest point yesterday at $8963. Currently, the price is being traded slightly lower after a minor retracement and is now in an upward trajectory, sitting at $8889.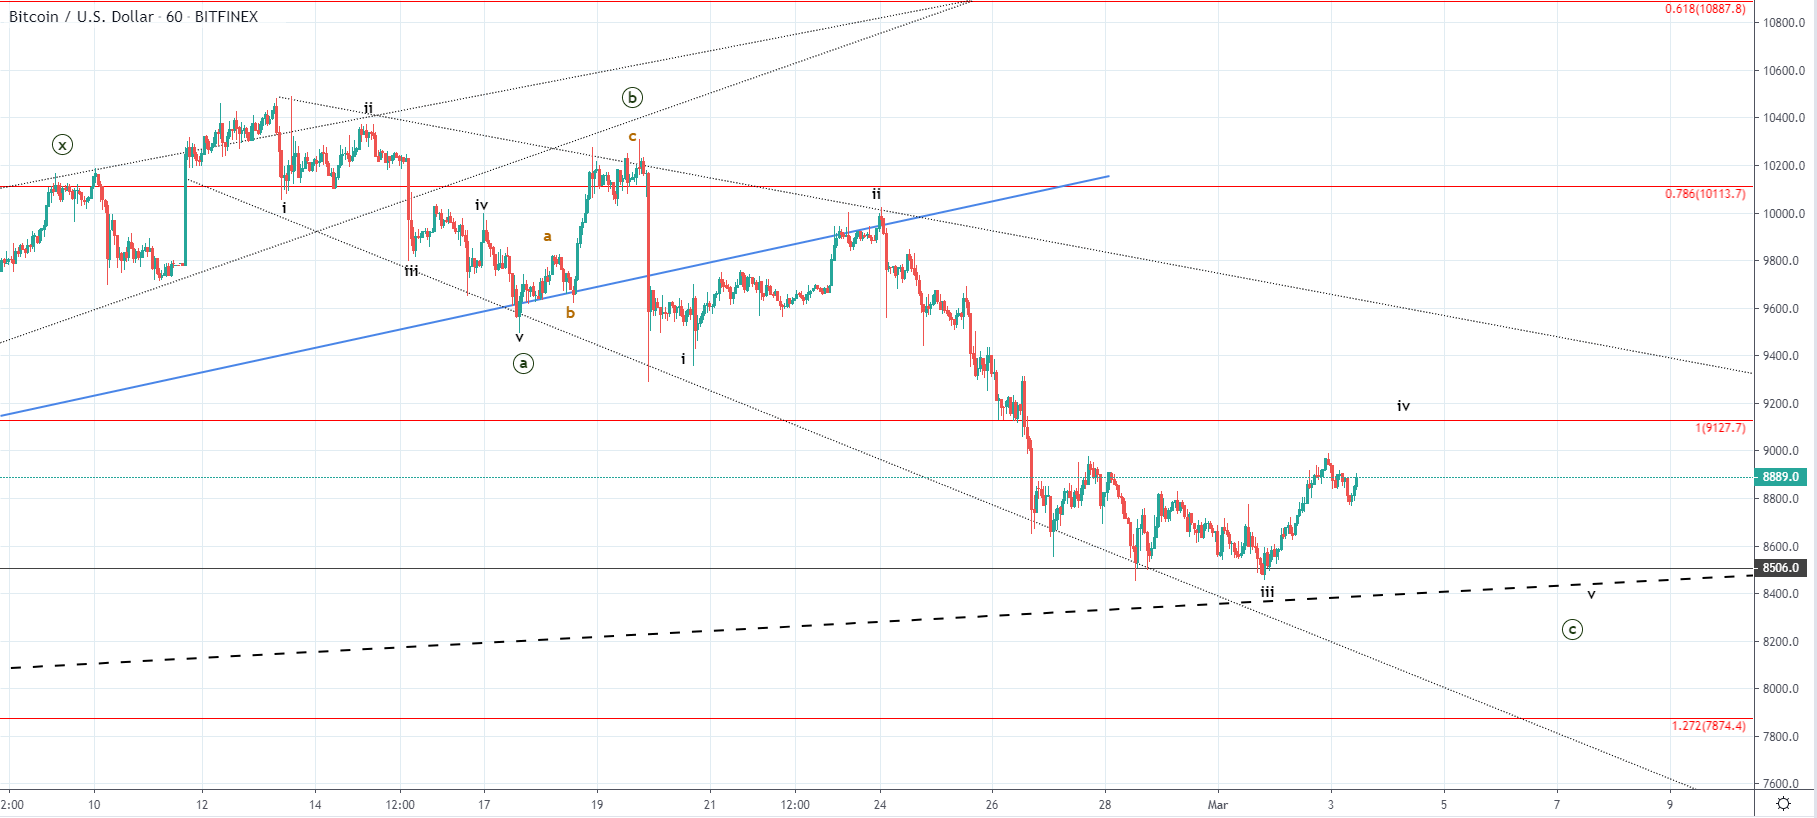
On the hourly chart, you can see that the price increase was straight up and that this downside move made since yesterday’s high was its first corrective move. Thus, we might see a further decline before further uptrend continuation occurs. The descending move would serve to retest some of the prior resistance levels for support especially the horizontal one of a lower range at around $8682 where the previous higher low ended.
If we are seeing the development of a three-wave correction to the upside another impulsive move would be expected after the development of the current retracement which could push the price of Bitcoin to test the descending channels resistance level which would bring the price up above $9000 again, but as this would be the 4th wave out of the five-wave move to the downside another lower low would be expected.
An alternative possibility would be that the ABC correction of a higher degree ended on the interaction with the $8506 level in which case we are seeing the development of the first wave out of the higher degree impulse wave to the upside, but in either way, from here I would be expecting further decline and retesting of support.
XRP/USD
The price of Ripple has also been following the market’s trend and recovered from Sunday’s low at $0.22556 by 7.3% coming to $0.24204. Since yesterday we have seen a minor retracement and another move to the upside with the price being traded at $0.23782 at the moment.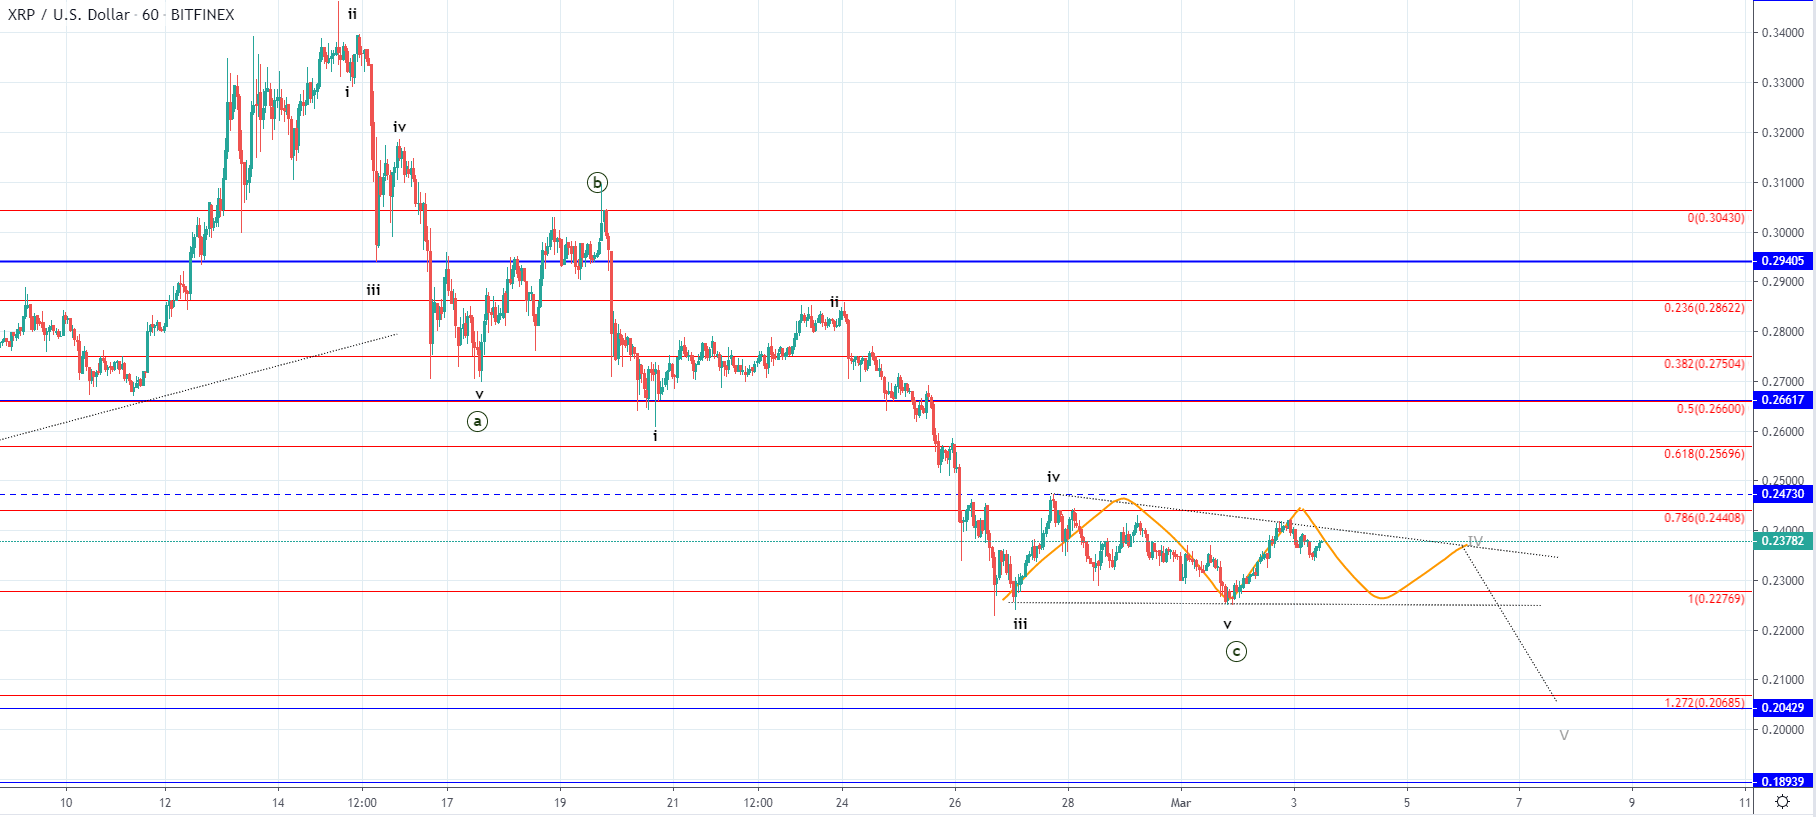
Looking at the hourly chart, you can see that I have outlined two possibilities that could be in play. Both are assuming that we are seeing an ABC to the downside but the difference is that in the main one further decrease can be seen as this range in which the price has been since the 26th of February can be the 4th wave out of the five-wave C to the downside. An alternative would be like in the case of Bitcoin that the ABC correction ended on Sunday’s low but considering the wave structure, I don’t believe that it’s as likely.
This is why we are going to look at the descending triangle’s resistance level for an early indication with whom we might see another interaction today.
FXOpen offers the world's most popular cryptocurrency CFDs*, including Bitcoin and Ethereum. Floating spreads, 1:2 leverage — at your service (additional fees may apply). Open your trading account now or learn more about crypto CFD trading with FXOpen.
*Important: At FXOpen UK, Cryptocurrency trading via CFDs is only available to our Professional clients. They are not available for trading by Retail clients. To find out more information about how this may affect you, please get in touch with our team.
This article represents the opinion of the Companies operating under the FXOpen brand only. It is not to be construed as an offer, solicitation, or recommendation with respect to products and services provided by the Companies operating under the FXOpen brand, nor is it to be considered financial advice.
Stay ahead of the market!
Subscribe now to our mailing list and receive the latest market news and insights delivered directly to your inbox.


Latest articles

EUR/USD Eyes Gains As USD/CHF Weakness Deepens Again
EUR/USD started a fresh increase above 1.1700 and 1.1720. USD/CHF declined further and is now struggling below 0.7835.
Important Takeaways for EUR/USD and USD/CHF Analysis Today
· The Euro started a decent increase from

Apple: Earnings Day Above the Activity Zone
On 30 April, after the market close, Apple Inc. will release its financial results for the second quarter of fiscal 2026. The consensus forecast, based on estimates from 31 analysts, points to revenue of around $109.7 billion, with expected

USD/JPY and USD/CHF Near Key Levels: The Dollar Supported by the Fed
The US dollar continues to trend upwards following the Federal Reserve meeting, drawing support from the regulator’s moderately hawkish stance and comments by Jerome Powell. Markets interpret the Fed’s rhetoric as a signal that restrictive policy is likely