


BTC and XRP - Have we seen a leading diagonal?
FXOpen

BTC/USD
From last week’s high at $7860 made on Friday measured to the lowest point the price has been yesterday at $7257.7 we have seen a decrease of 7.67%. The price is currently being traded at $7311.9 slightly higher then yesterday but is mostly hovering around the same horizontal range.
This could be interpreted as a consolidation range especially after a minor retracement especially considering that the price volatility has diminished.
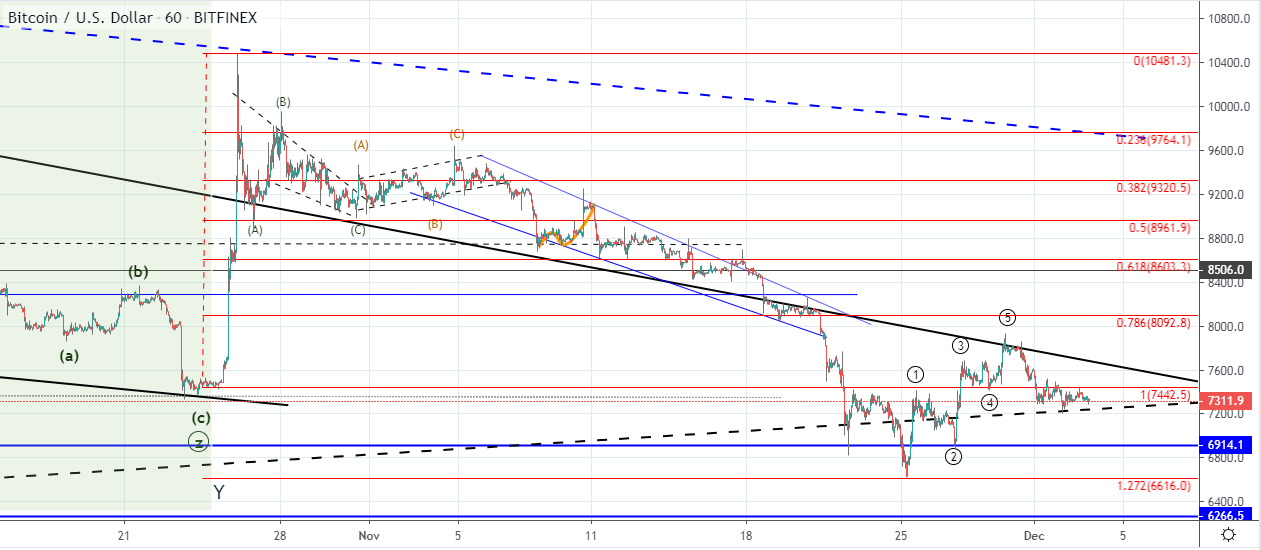
Looking at the hourly chart, you can see that the price bounced from the 1.272 Fibonacci level like expected and started increasing impulsively to the upside in a five-wave manner coming to retest the descending trendline which is the resistance level out of the descending channel from Jun. As the price found resistance there a retracement occurred below the prior low at $7442 but above the interrupted ascending trendline from the baseline support dating from February which is a good sign.
As the price decrease seen from the 26rd of October ended we could be seeing the start of another impulsive move to the upside in which case the minor retracement seen would be its 2nd wave. If this is true then the price is to continue increasing from here after establishing support at the present levels which would be the 3rd wave of a higher degree.
Another possibility would be that the five-wave move to the upside seen from last week is corrective in nature which means that the price isn’t undergoing a minor retarcement but the downtrend continuation.
This will be validated buy the current range as if the price find support here it would likely indicate further price growth but if the price continues moving below the interrupted ascending trendline it would likely indicate further lower lows.
XRP/USD
From last Friday when the price of Ripple came up to $0.23307 we have seen a decrease of 5.78% as the price came down to $0.2199 at its lowest point yesterday which is again currently being retested for support.
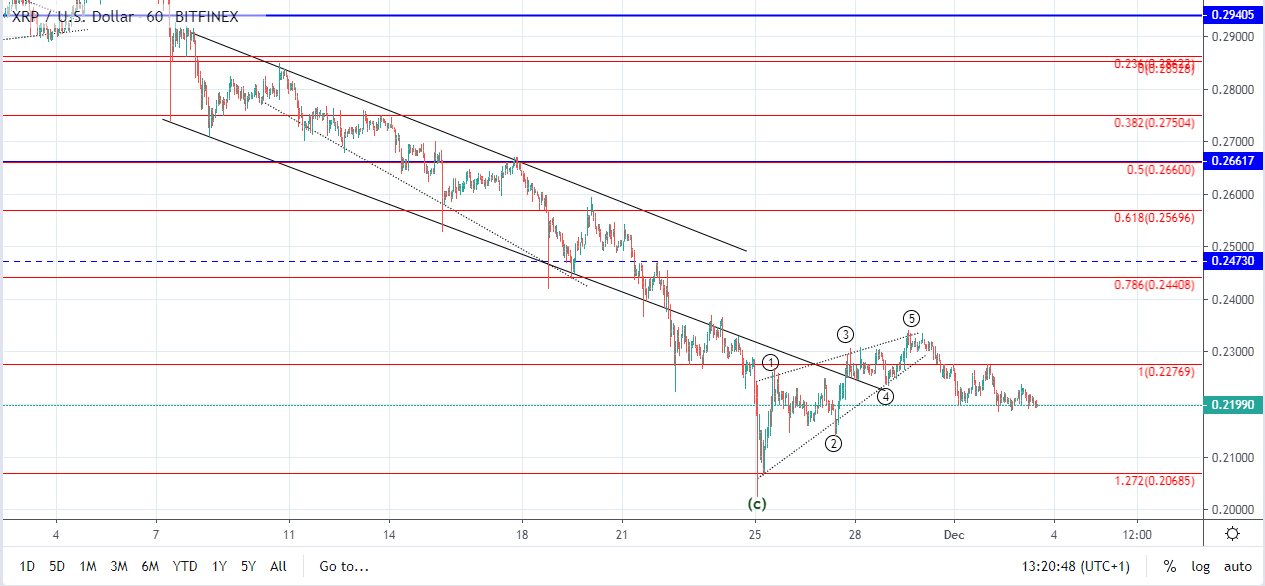 On the hourly chart, you can see that the price is made a five-wave recovery similar like on the chart of Bitcoin and formed an ascending triangle. With the price decrease now retesting the horizontal support we are yet to see if the support is present.
If the price find support at the current levels and starts increasing again, coming above the 1 Fib level it could indicate that we have seen the 1st wave out of the higher degree impulse which ended as a leading diagonal. But if the price continues moving below the current support a retest of the 1.272 Fib level could be seen.
The C wave out of the previous ABC correction to the downside has likely ended which is why I would be expecting an increase over further lows but this must be verified by the presumed 2nd wave which is currently developing.
FXOpen offers the world's most popular cryptocurrency CFDs*, including Bitcoin and Ethereum. Floating spreads, 1:2 leverage — at your service (additional fees may apply). Open your trading account now or learn more about crypto CFD trading with FXOpen.
*Important: At FXOpen UK, Cryptocurrency trading via CFDs is only available to our Professional clients. They are not available for trading by Retail clients. To find out more information about how this may affect you, please get in touch with our team.
This article represents the opinion of the Companies operating under the FXOpen brand only. It is not to be construed as an offer, solicitation, or recommendation with respect to products and services provided by the Companies operating under the FXOpen brand, nor is it to be considered financial advice.
Stay ahead of the market!
Subscribe now to our mailing list and receive the latest market news and insights delivered directly to your inbox.


Latest articles

DAX 40: consolidation amid technology sell-off
A wave of selling in the technology sector that emerged earlier this week has weighed on European equities. The trigger was investor concern over the profitability of large-scale debt-funded investments by major US tech companies in AI infrastructure. The Nasdaq

Euro Hits Fresh Yearly Lows Amid Dovish ECB Signals
The euro remains under pressure following weak macroeconomic data from the euro area and fresh signals that the European Central Bank is prepared to maintain a more accommodative monetary policy stance. Data released yesterday pointed to a deterioration in business

Pound at Key Levels: Markets Assess Impact of Political Uncertainty in the UK
The British pound remains under pressure following increased political uncertainty in the United Kingdom triggered by the Prime Minister’s resignation. Investors are assessing potential shifts in the political and economic policy outlook after the head of government stepped down,