


FXOpen
BTC/USD
The price of Bitcoin has fallen by 18% from last Monday’s high at around $12074 measured to its lowest point made on Sunday at around $9860 which was retested again yesterday. From yesterday’s low, the price started increasing again and made a higher high but we currently seeing a minor retracement with the price looking for support around $10173 area.
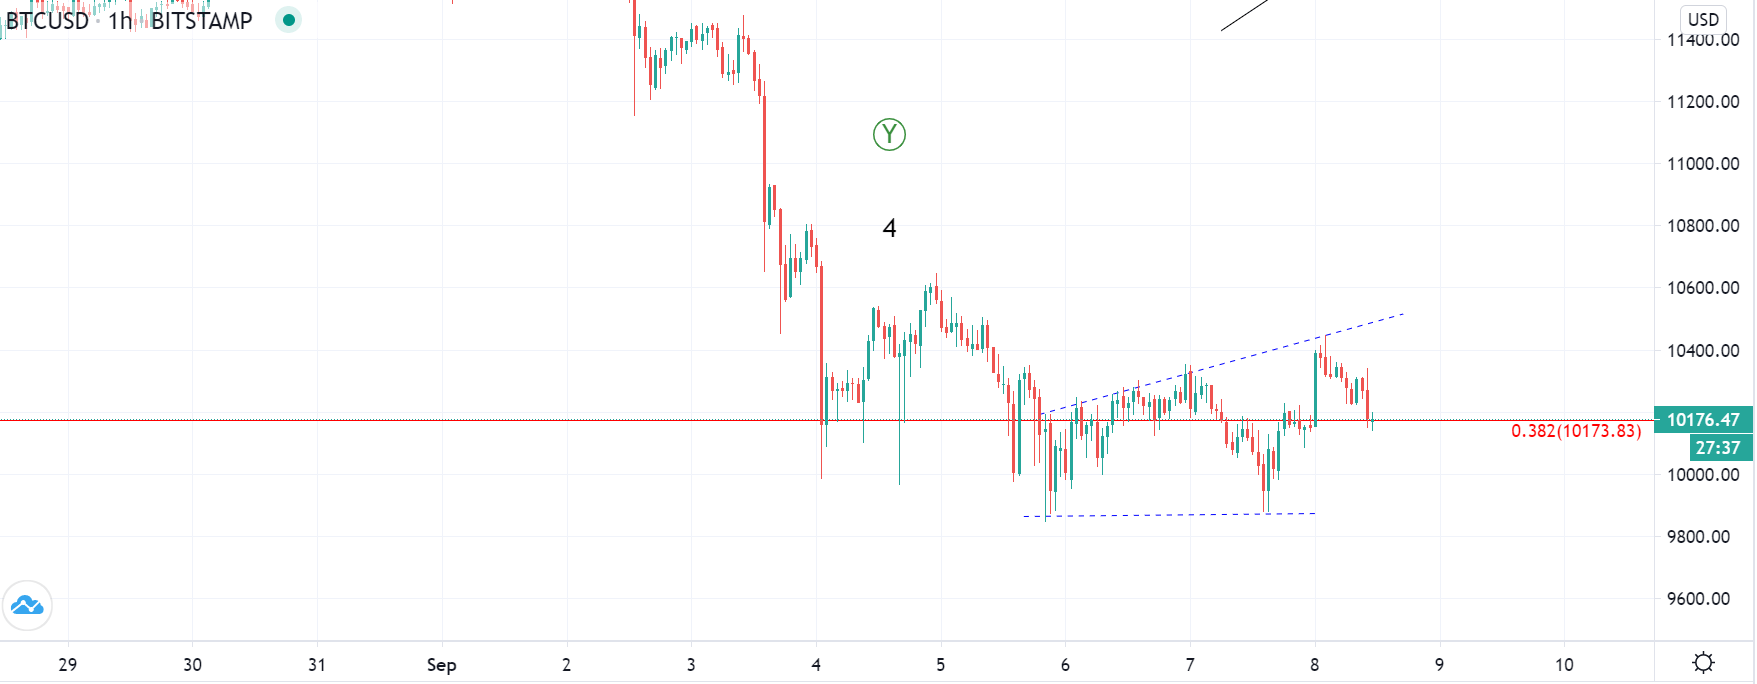
On the hourly chart, you can see that the price is testing the 0.382 Fib level at the moment for support and is likely to find the support there if we have seen the completion of the descending move and the beginning of a recovery of a higher degree.
Potentially another retest of the Sunday’s low could be seen as the price has started forming a horizontal level whose validation is still awaited by the third interaction but is more likely forming an ascending range in which further highs could be expected.
If this was the completion of the 4th wave from the higher degree count made on Sunday, the increase after and the retest of its prior low could be the first two waves of a lower degree count. This makes the current one being the third one in development and with its first sub-wave showing a five-wave move, its is showing signs of impulsiveness already.
If the price finds support on the 0.382 Fibonacci level and continues increase past the ascending resistance it could be an early indication that it started developing its 5th wave from the higher degree count which is set to bring the price of Bitcoin into new higher highs.
But if the price doesn’t find support around the vicinity of the current level and continues decreasing from here it would mean that we have seen a three-wave correction to the upside with the increase made from yesterday’s retest the C wave.
XRP/USD
The price of Ripple has fallen in a similar manner like the price of Bitcoin as from the 1st of September we have seen a decrease of 24.17% coming from slightly above $0.3 to $0.23 at its lowest on Sunday. Since then recovery has been made with the price currently sitting at $0.23640.
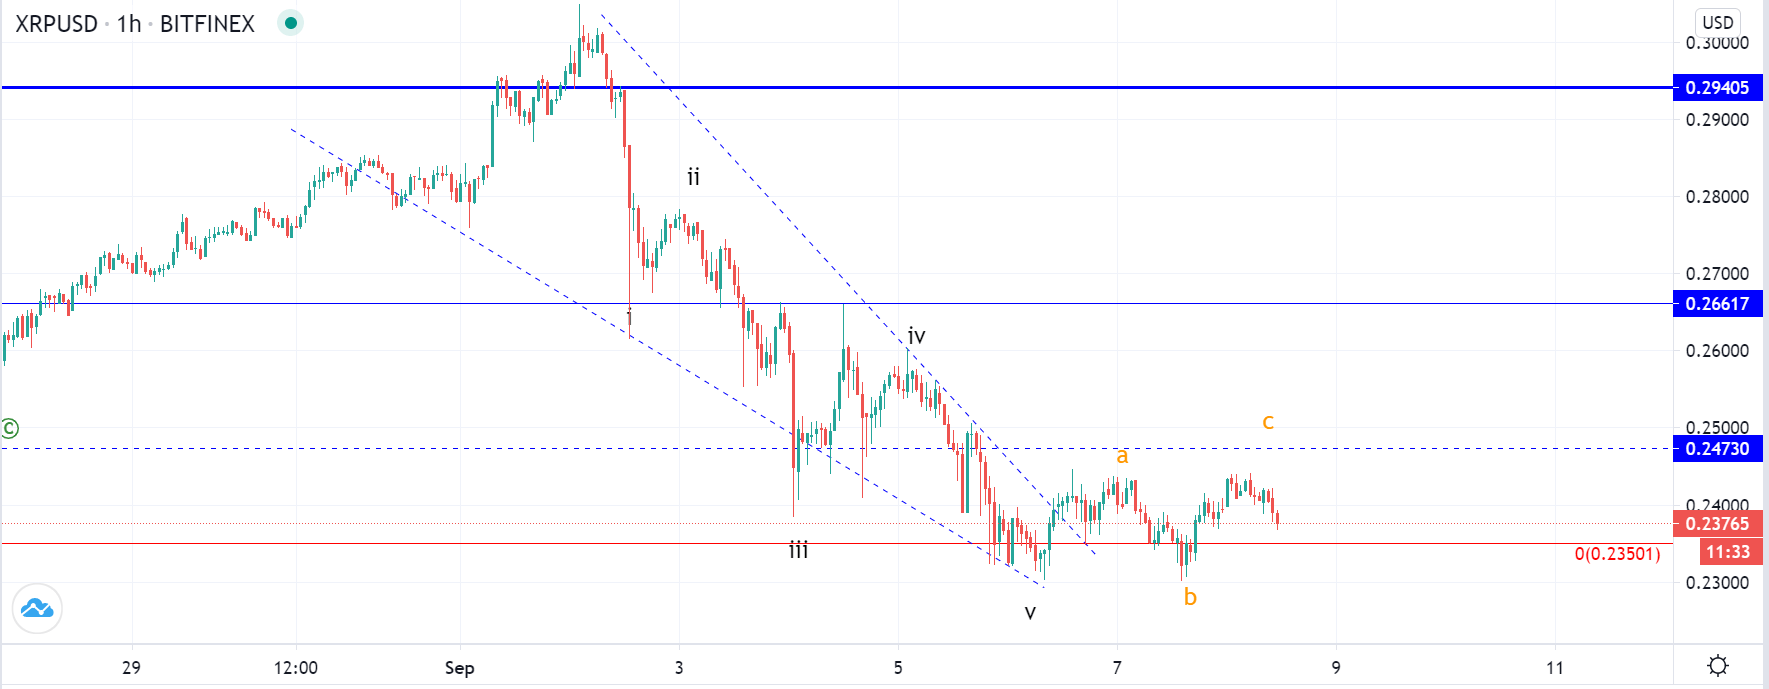
As you can see by looking at the hourly chart, the price made a five-wave decrease to the downside in a descending triangle. This could either be a corrective ABCDE count or an impulsive move. Considering what’s been said for Bitcoin the same applies to Ripple. We could be seeing the start of the higher degree move to the upside out of which the current one is the first sub-wave of the 3rd wave, or we could have seen the completion of a corrective ABC to the upside.
In the first case, the price is to find support shorty and continue moving to the upside again but if it continues moving to the downside below the 0 Fib level the second scenario would look more likely at this stage.
Open a Crypto 10 account and trade with FXOpen!
FXOpen offers the world's most popular cryptocurrency CFDs*, including Bitcoin and Ethereum. Floating spreads, 1:2 leverage — at your service. Open your trading account now or learn more about crypto CFD trading with FXOpen.
*At FXOpen UK and FXOpen AU, Cryptocurrency CFDs are only available for trading by those clients categorised as Professional clients under FCA Rules and Professional clients under AFSL 412871 – ABN 61 143 678 719 respectively. They are not available for trading by Retail clients.
This article represents the opinion of the Companies operating under the FXOpen brand only. It is not to be construed as an offer, solicitation, or recommendation with respect to products and services provided by the Companies operating under the FXOpen brand, nor is it to be considered financial advice.
Stay ahead of the market!
Subscribe now to our mailing list and receive the latest market news and insights delivered directly to your inbox.

Latest articles

Coca-Cola (KO) Share Price Drops Sharply After Earnings Report
On 23 October, Coca-Cola (KO) released its third-quarter earnings, which exceeded forecasts:
→ Earnings per share (EPS): Actual = $0.77; Expected = $0.74
→ Gross revenue: Actual = $11.95 billion; Expected = $11.69 billion
Despite these positive results, KO's share price saw
ETH/BTC Hits 44-Month Low
The ETH/BTC exchange rate has reached its lowest level in 44 months, as shown on the ETH/BTC chart, indicating that in 2024, cryptocurrency investors seem to favour Bitcoin over Ethereum.
The downward trend, shown by the red channel,

What Is a Doji Candle, and How Can You Use It in Trading?
A Doji candle is a technical analysis tool reflecting the uncertainties in the market. Although it provides strong signals, it should be used with other patterns or technical indicators. Why do traders look for Dojis when trading stocks, commodities, and