


BTC and XRP - Lower low expected
FXOpen
BTC/USD
On Sunday the price of Bitcoin was sitting at $7288 at its highest point from where it started decreasing in a five-wave manner. Yesterday we have seen a slight recovery but after it’s a completion at $7218 the price started impulsively decreasing falling to $6777 at it’s lowest point yesterday. Since then another minor recovery has been seen with the price currently being traded at $6861.
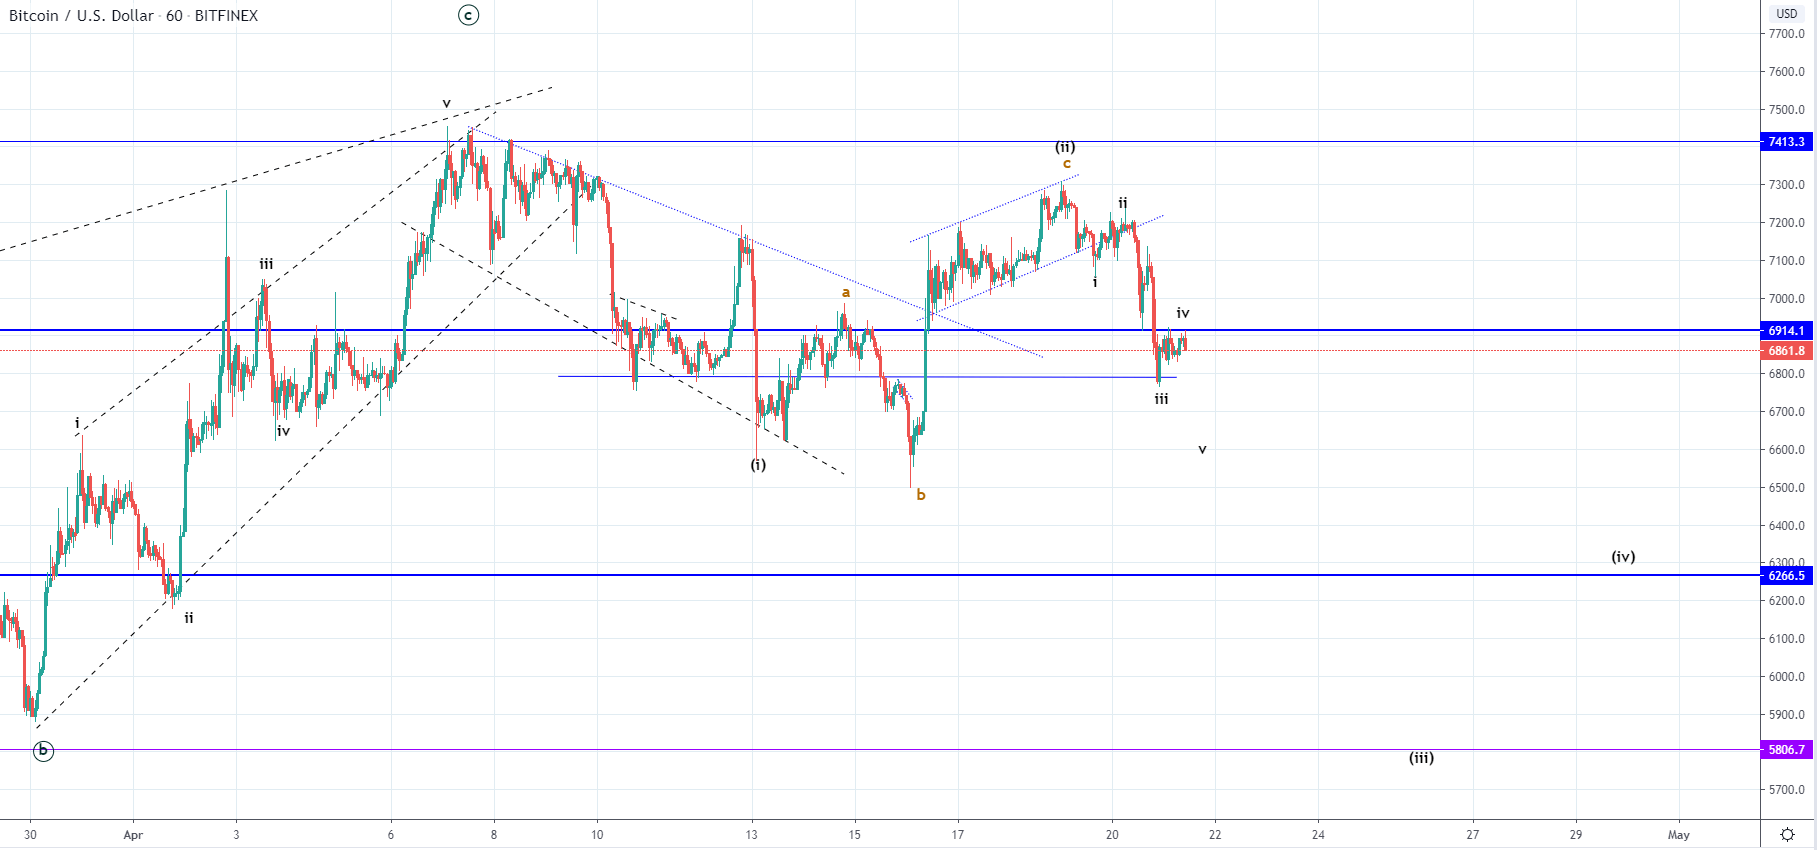 On the hourly chart, you can see that the price fell below the significant horizontal support at $6914 and has retested it today, finding resistance there. This rejection would most likely push the price to continue moving for another lower low, especially considering that from Sunday’s high we have seen a 4 wave’s developing and is likely to ends as a five-wave decrease.
If this occurs the price would form an impulsive move to the downside after a breakout has been made from the ascending channel. In that case, we could be seeing the development of the 3rd wave from the higher degree count as the prior upside move ending with the mentioned ascending channel could have been corrective 2nd wave and the descending channel from the 7th of April it’s 1st.
The price target for the expected lower low would be at around $6680 but could continue below the ending point of the B wave from the 2nd sub-wave in which case $6450 could be seen. But if the price starts impulsively increasing from here the count would be valid until it would reach $7100 where the territory of the 1st wave is.
XRP/USD
The price of Ripple has been following the same pattern as in the case of Bitcoin. From Sunday’s high at $0.197 we have seen a decrease to $0.189 horizontal level, a bounce from it to $0.194 but immediately after fell to $0.1793 which is a decrease of 7.95% from yesterday’s high. Now the price is sitting at around $0.183 and is in a downward trajectory after a minor recovery.
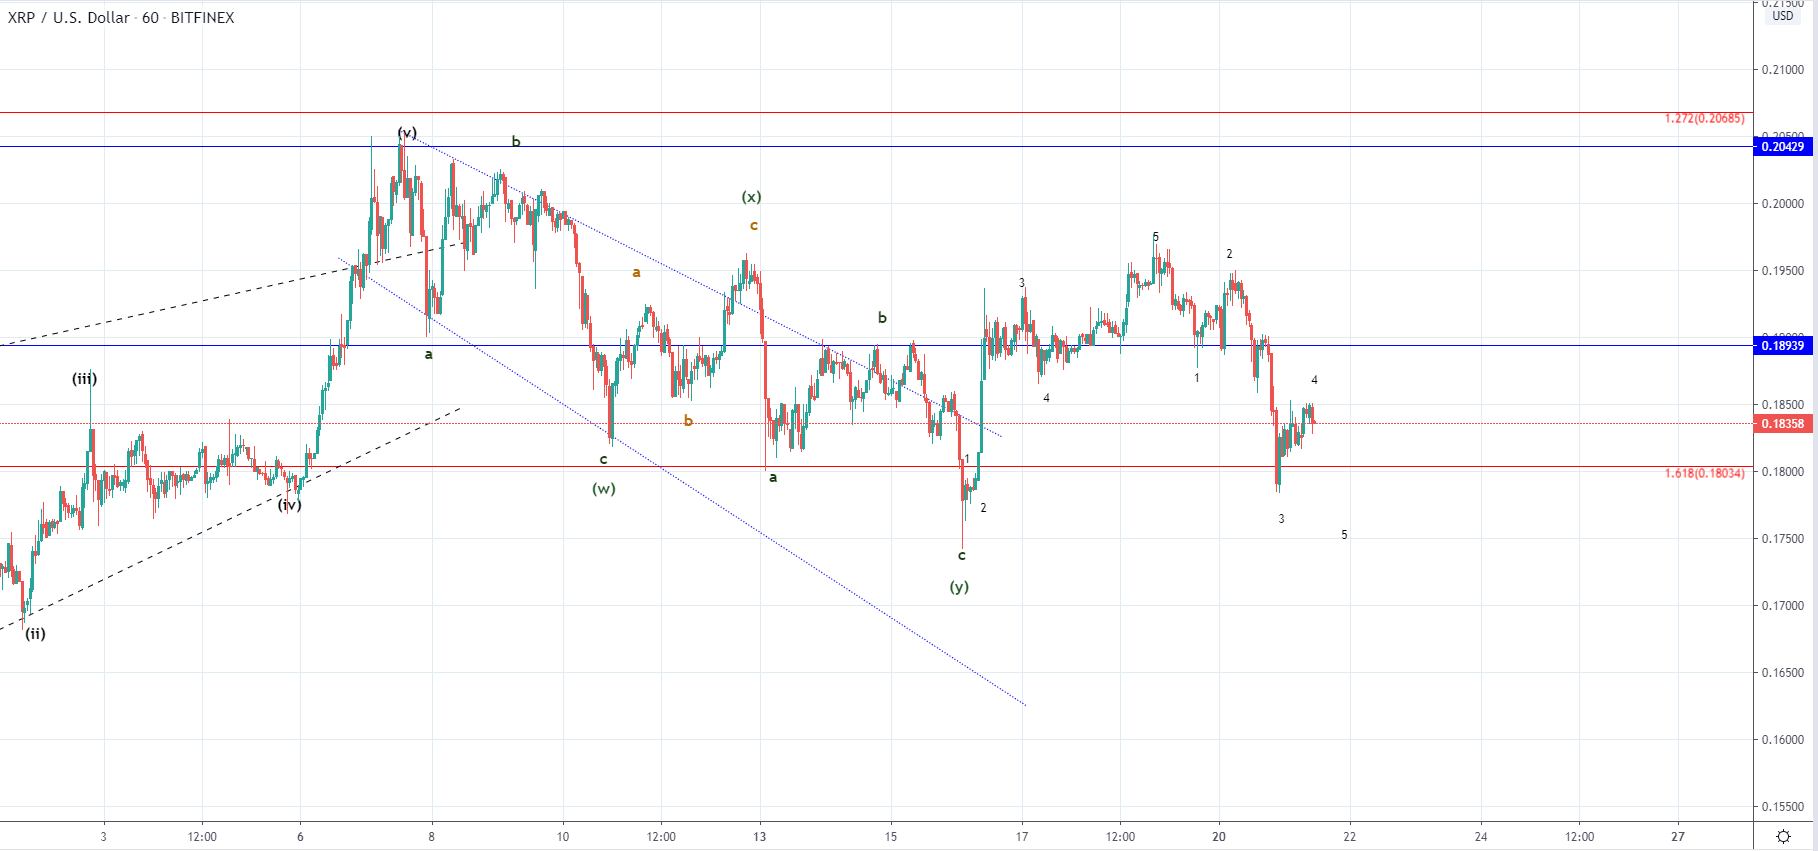 Looking at the hourly chart, you can see that like in the case of Bitcoin we have seen 4 waves developing from Sundays high. This is most likely to end as a five-wave decrease with another local lower low below the 1.618 Fibonacci level. Prior to the impulsive descending move, we have seen the price in an upward trajectory in a five-wave manner. This could have been the C wave out of the corrective move to the upside but it could have been the starting wave out of the next impulsive move.
If the price continues moving below the $0.1776 this possibility would be invalidated as the price can’t go below the starting point of it’s 1st wave on the 2nd.
FXOpen offers the world's most popular cryptocurrency CFDs*, including Bitcoin and Ethereum. Floating spreads, 1:2 leverage — at your service (additional fees may apply). Open your trading account now or learn more about crypto CFD trading with FXOpen.
*Important: At FXOpen UK, Cryptocurrency trading via CFDs is only available to our Professional clients. They are not available for trading by Retail clients. To find out more information about how this may affect you, please get in touch with our team.
This article represents the opinion of the Companies operating under the FXOpen brand only. It is not to be construed as an offer, solicitation, or recommendation with respect to products and services provided by the Companies operating under the FXOpen brand, nor is it to be considered financial advice.
Stay ahead of the market!
Subscribe now to our mailing list and receive the latest market news and insights delivered directly to your inbox.


Latest articles

Apple: Earnings Day Above the Activity Zone
On 30 April, after the market close, Apple Inc. will release its financial results for the second quarter of fiscal 2026. The consensus forecast, based on estimates from 31 analysts, points to revenue of around $109.7 billion, with expected

USD/JPY and USD/CHF Near Key Levels: The Dollar Supported by the Fed
The US dollar continues to trend upwards following the Federal Reserve meeting, drawing support from the regulator’s moderately hawkish stance and comments by Jerome Powell. Markets interpret the Fed’s rhetoric as a signal that restrictive policy is likely

EUR/USD and GBP/USD consolidate ahead of the Fed decision
European currencies are showing subdued dynamics, entering a consolidation phase following their previous advance. Earlier, EUR/USD and GBP/USD broke out of their ranges and strengthened; however, the subsequent correction has led both pairs to retest the previously breached