


BTC and XRP - More upside expected
FXOpen

BTC/USD
From yesterday’s open when the price of Bitcoin was sitting at $9402, we have seen an increase of 10.44% measured to the highest point the price has been today which is at $10383. Since then we have seen a minor retracement with the price currently being traded at $10137.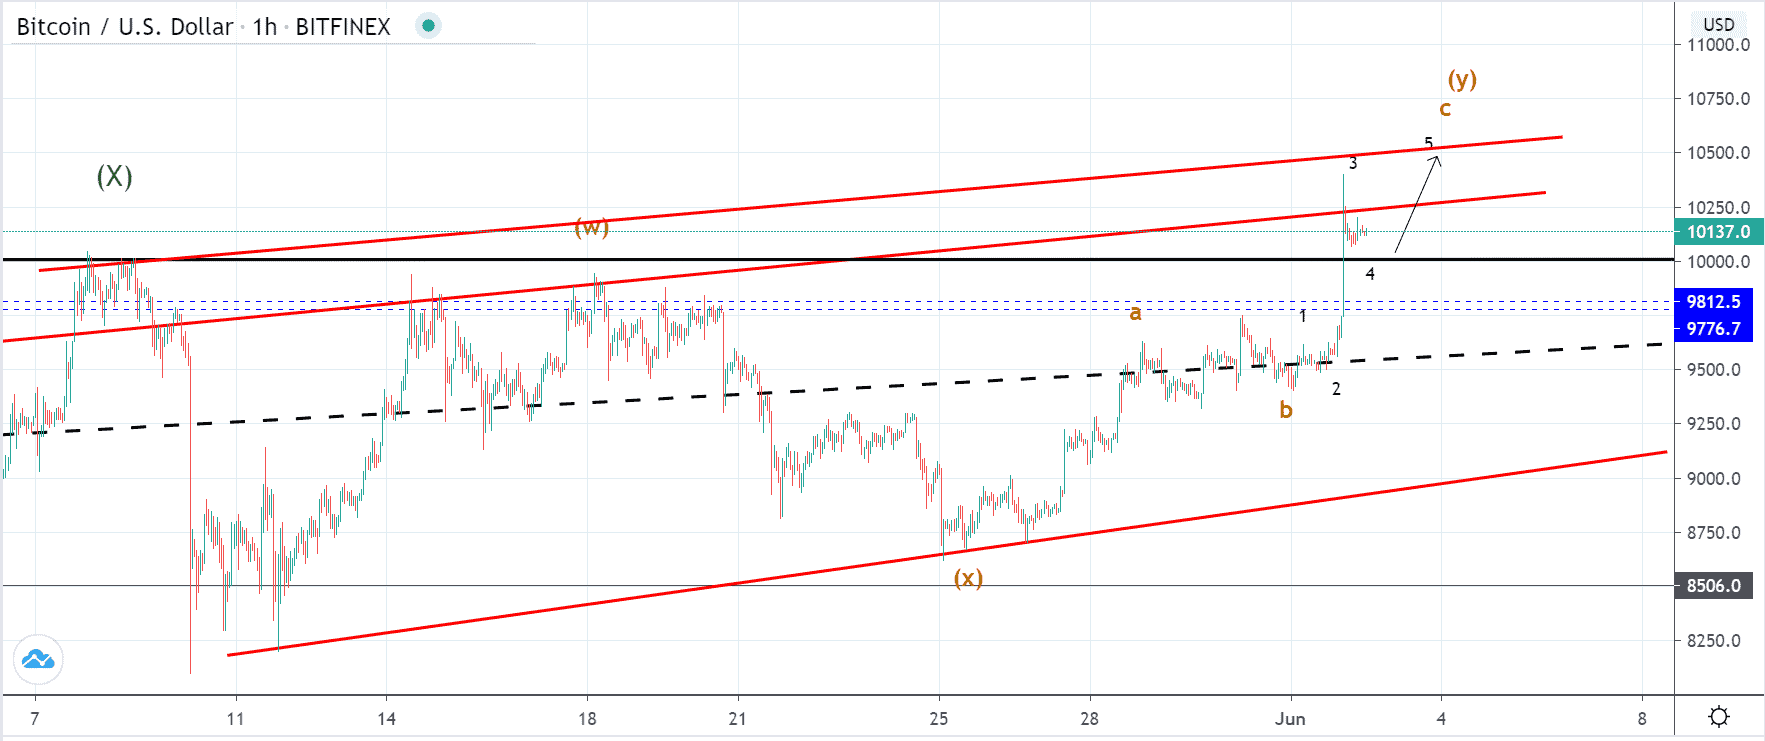 As you can see by looking at the hourly chart, the previous count has been invalidated as the price spiked above the May’s high previously presumed to be the ending point of the X wave of a higher degree. After it’s completion we have seen an impulsive move which was labeled as the 1st wave out of the starting impulse to the downside but now as the price got above the presumed starting point of the 1st wave we have seen an invalidation.
An ascending channel has started forming unline the previous triangle which was also invalidated but the ascending channel is still unconfirmed even though we might have seen a retest of the lower resistance level.
A retest of its upper resistance level could be expected as we are most likely seeing the development of another five-wave impulse to the upside which if corrective in nature should be the end of this increase and would be expected to reach $10500-10700 area.
If the price continues moving for another upward move then this would be the start of the 5th wave of a higher degree count.
XRP/USD
The price of Ripple has increased by 7.1% from yesterday’s low $0.2 measured to today’s high at $0.2154. It’s still being traded unlike in the case of Bitcoin.
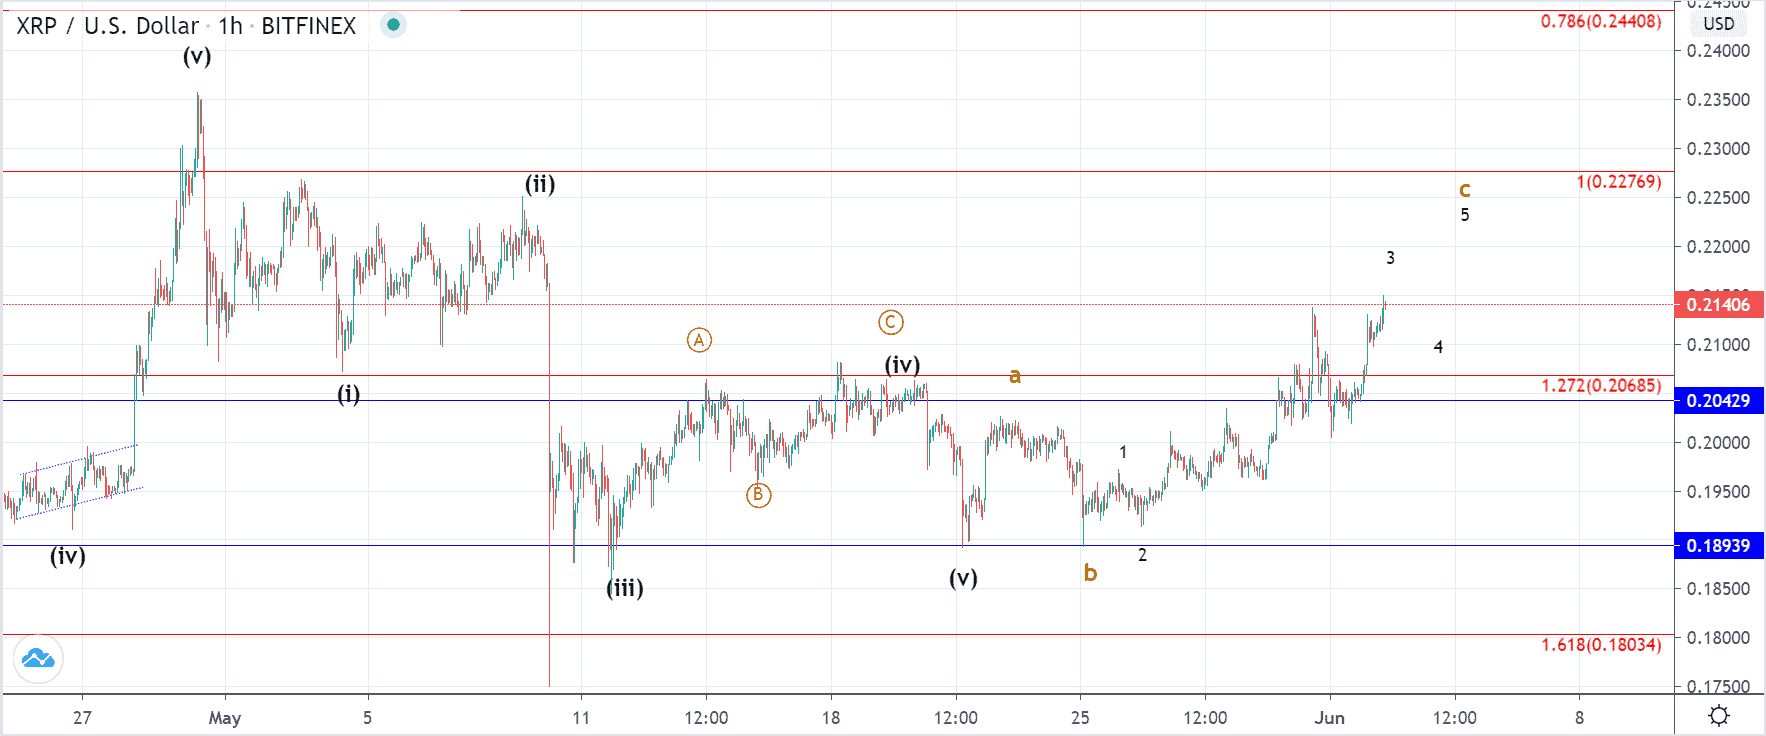 On the hourly chart, you can see that the prior count has been invalidated with the prior descending five-wave impulse ending at the significant horizontal $0.18939 after which it appears that a corrective three-wave increase has started.
This is why I would be expecting a further increase to around the vicinity of the ending point of the 2nd wave from the previous descending impulse bringing the price target $0.222. According to this new count, it would be the completion of the C wave from the upward ABC after which further downtrend continuation would be anticipated.
If however the price exceeds this level and makes a minor retracement before continuing to move further to the upside it could indicate that we are seeing the development of a new uptrend altogether with the current ascending move being the 3rd wave out of the five-wave impulse instead of the now presumed C wave.
FXOpen offers the world's most popular cryptocurrency CFDs*, including Bitcoin and Ethereum. Floating spreads, 1:2 leverage — at your service (additional fees may apply). Open your trading account now or learn more about crypto CFD trading with FXOpen.
*Important: At FXOpen UK, Cryptocurrency trading via CFDs is only available to our Professional clients. They are not available for trading by Retail clients. To find out more information about how this may affect you, please get in touch with our team.
This article represents the opinion of the Companies operating under the FXOpen brand only. It is not to be construed as an offer, solicitation, or recommendation with respect to products and services provided by the Companies operating under the FXOpen brand, nor is it to be considered financial advice.
Stay ahead of the market!
Subscribe now to our mailing list and receive the latest market news and insights delivered directly to your inbox.


Latest articles

EUR/USD Eyes Gains As USD/CHF Weakness Deepens Again
EUR/USD started a fresh increase above 1.1700 and 1.1720. USD/CHF declined further and is now struggling below 0.7835.
Important Takeaways for EUR/USD and USD/CHF Analysis Today
· The Euro started a decent increase from

Apple: Earnings Day Above the Activity Zone
On 30 April, after the market close, Apple Inc. will release its financial results for the second quarter of fiscal 2026. The consensus forecast, based on estimates from 31 analysts, points to revenue of around $109.7 billion, with expected

USD/JPY and USD/CHF Near Key Levels: The Dollar Supported by the Fed
The US dollar continues to trend upwards following the Federal Reserve meeting, drawing support from the regulator’s moderately hawkish stance and comments by Jerome Powell. Markets interpret the Fed’s rhetoric as a signal that restrictive policy is likely