


BTC and XRP - Prices Breakout With Further Appreciation Looking Ahead
FXOpen

BTC/USD
The price of Bitcoin has been increasing from last Friday when it was sitting around $11221 at its lowest and reached $11847 at its highest today which is an appreciation of 5.58%. Currently, we have seen a minor pullback but the price is still in an upward trajectory indicating strong bullish momentum.
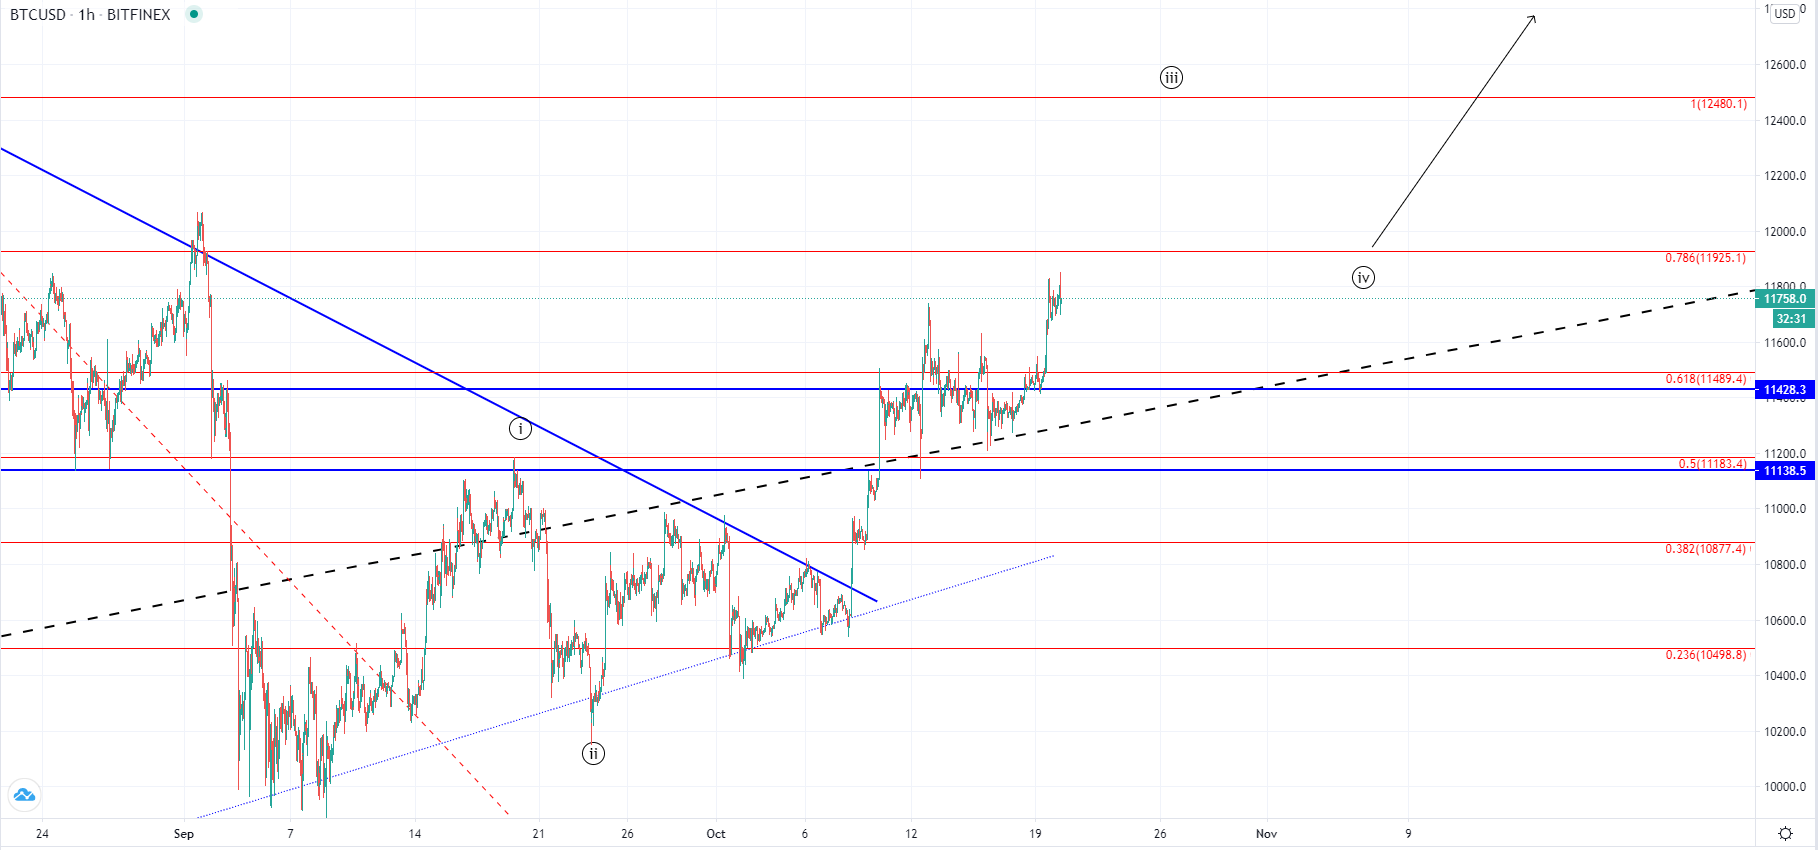
On the hourly chart, you can see that a breakout was been made above the prior high made last week on Monday and the price is now retesting its levels for support. This minor pullback is likely the 4th wave out of the lower degree impulse wave which is why another increase would be expected from here before a more significant one. That correlates with the current rest on the support level as the price is likely to finds support here.
Looking at the bigger picture this rise is the continuation of the upward move that started in September after the price came down to $9889 on the 8th. Since then we have seen a series of higher lows which indicated the start of another upward impulse but today’s higher high has validated that even further. This is why we are likely to expect further uptrend continuation as this increase is the next five-wave move to the upside out of which we are currently seeing the development of the 3rd wave from the Minute count.
If this is true, then the price is headed for a higher high on this 3rd wave, pulling back on the 4th to retest the vicinity of the yearly high and going to continue moving to the level above $13000 which is the zone of the last year’s highs.
XRP/USD
From last Tuesday when the price of Ripple was $0.26 to at its highest we have seen a decrease of 8.22% measured to its Fridays low at $0.238. The price started increasing from there as it found support on the ascending trendline and came slightly above the $0.25 level but has since fallen again below the $0.2473 horizontal pivot point. Now it is again attempting to surpass the levels as it’s in an upward trajectory but we are yet to see if the momentum proves strong enough.
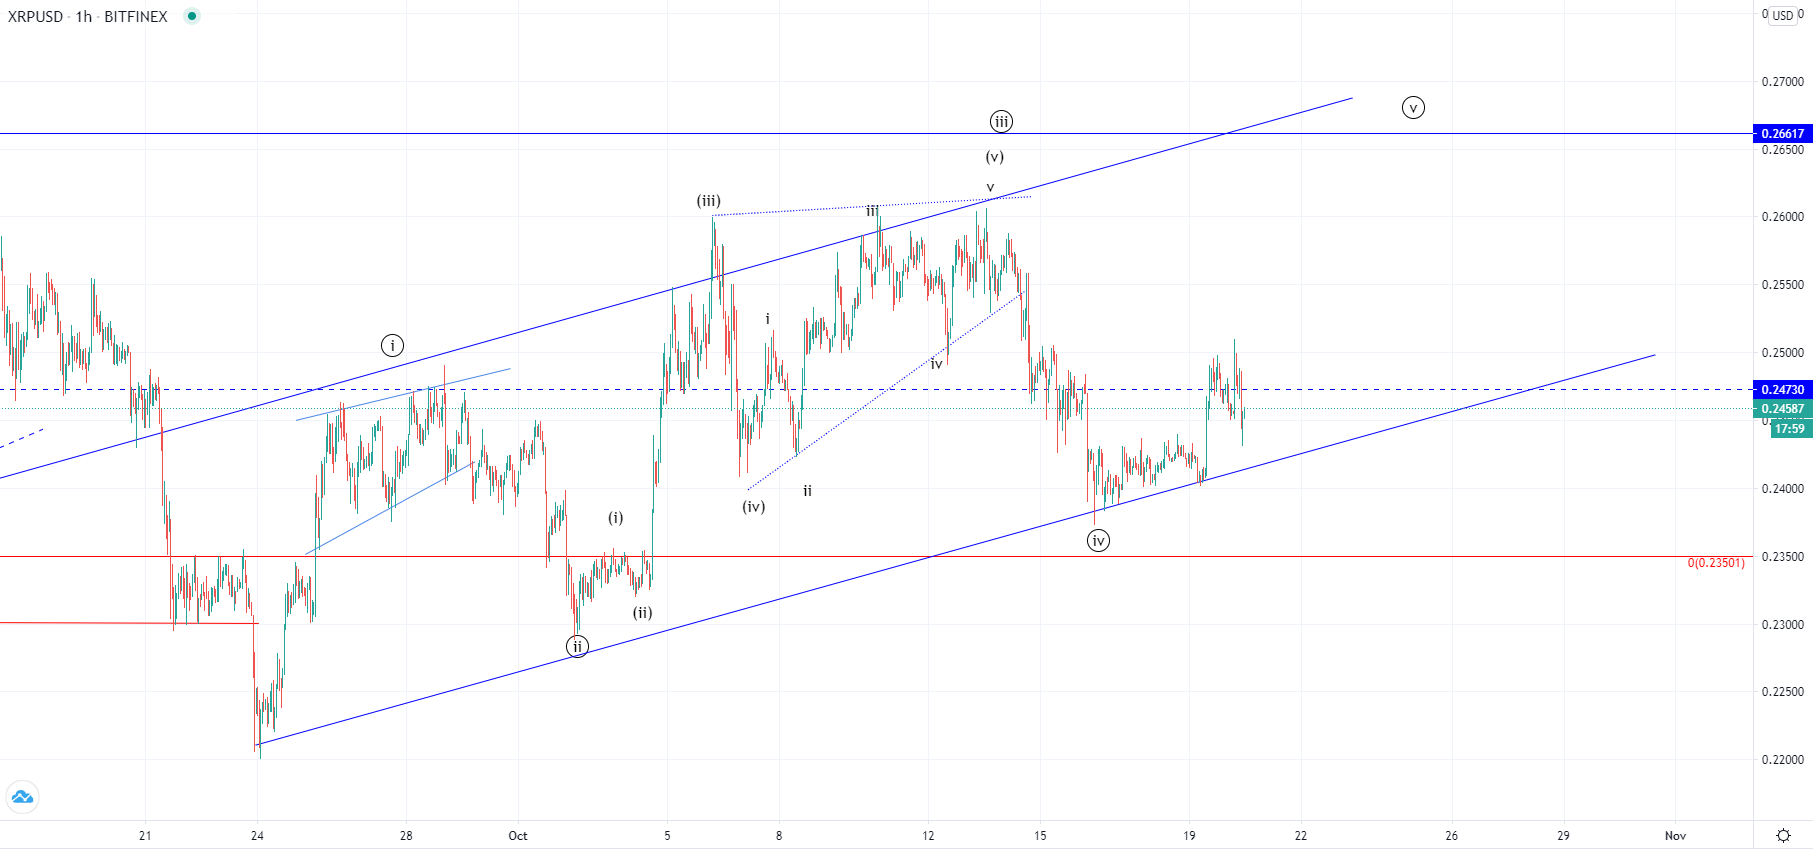
Looking at the hourly chart, you can see that the price has bounced inside this ascending channel from the 24th of September when it came down to $0.22 at its lowest and last Tuesdays high was most likely the competition of the 3rd wave of the higher degree count. This is why the 8.22% decrease seen is counted as the 4th wave which fell back inside the territory of the 1st one but which can happen in a leading diagonal which this structure appears to be.
If we see a breakout above the significant horizontal resistance the price is likely headed slightly above the $0.26 area and the previous higher high for the completion of the 5th wave and would validate the ascending channel’s resistance level once more.
FXOpen offers the world's most popular cryptocurrency CFDs*, including Bitcoin and Ethereum. Floating spreads, 1:2 leverage — at your service (additional fees may apply). Open your trading account now or learn more about crypto CFD trading with FXOpen.
*Important: At FXOpen UK, Cryptocurrency trading via CFDs is only available to our Professional clients. They are not available for trading by Retail clients. To find out more information about how this may affect you, please get in touch with our team.
This article represents the opinion of the Companies operating under the FXOpen brand only. It is not to be construed as an offer, solicitation, or recommendation with respect to products and services provided by the Companies operating under the FXOpen brand, nor is it to be considered financial advice.
Stay ahead of the market!
Subscribe now to our mailing list and receive the latest market news and insights delivered directly to your inbox.


Latest articles

EUR/USD and GBP/USD consolidate ahead of the Fed decision
European currencies are showing subdued dynamics, entering a consolidation phase following their previous advance. Earlier, EUR/USD and GBP/USD broke out of their ranges and strengthened; however, the subsequent correction has led both pairs to retest the previously breached

Meta: V-Shaped Recovery Meets Heavy Volume Resistance
The movement in Meta Platforms shares is being driven by two competing narratives. On one hand, advertising revenue is benefiting from AI-based tools: the Advantage+ platform continues to support strong advertiser demand, and the analyst consensus for Q1 2026 revenue

Commodity Currencies Test Key Levels Ahead of Major Macro Data
Commodity-linked currencies are trading near key levels, showing restrained price action as market participants adopt a wait-and-see approach. The fundamental backdrop is shaped by expectations surrounding the release of Australia’s inflation data and the Bank of Canada’s interest