


FXOpen
BTC/USD
From yesterday’s low at $9931 the price of Bitcoin increased by 10% as it came up to $10932.2 at its highest point today. The price is currently being traded slightly lower at $10676 as a minor pullback occurred.
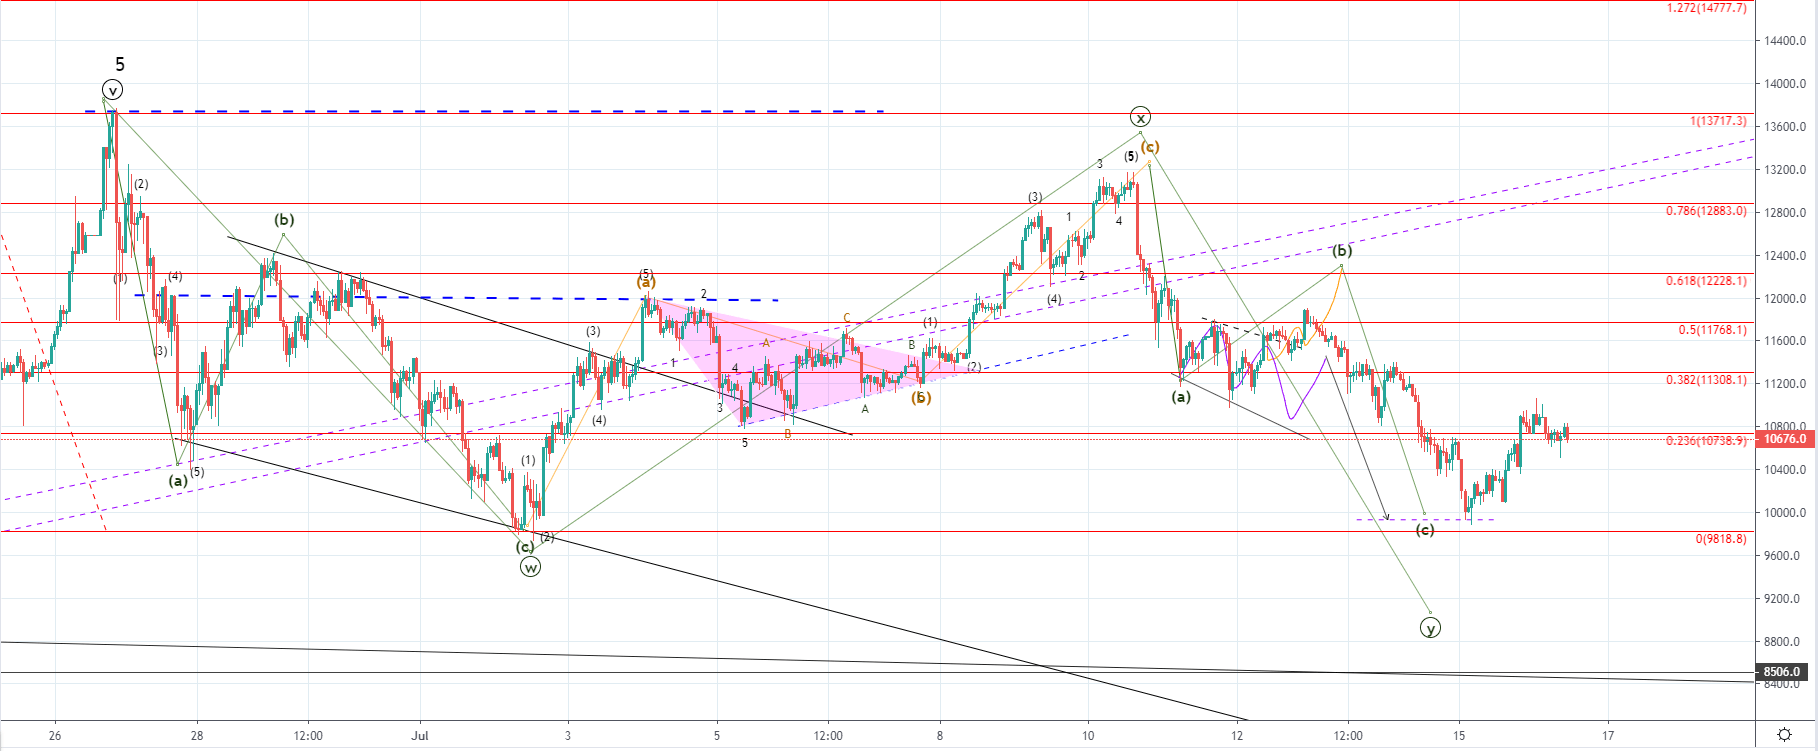
On the hourly chart, you can see that the price came above the 0.236 Fib level on today’s high and is currently retesting it for support on the retracement. The price is slightly below the Fib level but we can’t say that a breakout started as the price managed to stay around the level for eight hours. Today’s high was followed by wicks from the upper side which indicates that the price has entered the seller’s territory but we have seen a wick from the lower side on the hourly candle below the 0.236 Fib level which indicated buyers presence.
As the price is stuck in a consolidative range after an increase we could see a breakout from both sides. The price could find support here and continue moving to the upside for interaction with the next Fib level at $11308.1 or the seller’s pressure might be proven stronger in which case a drop below 0.236 level would occur.
We have seen the completion of the three-wave move to the downside yesterday which was most likely the third ABC correction out of the higher degree WXY. The recovery which followed could either be the start of the next impulse wave to the upside if the correction ended or could be the 4th corrective wave after another 5th one to the downside occurs in which case the downfall seen from the 10th of July when the price of Bitcoin was $13100 would be a five-wave move instead of the now labeled ABC.
If the price doesn’t exceed the 0.382 Fibonacci level on the current rise and rejection there causes a downfall below the 0.236 Fibonacci level, a lower low and the 5th wave scenario would look likely. But if the price manages to increase to the 0.5 Fib level at $11768.1 the start of another upside move would look more likely.
XRP/USD
From yesterday’s low at $0.29979 the price of Ripple has increased by 6.63% today as it came up to $0.31996 at its highest point today. The price is currently being traded at around $0.31 as a minor retracement occurred.
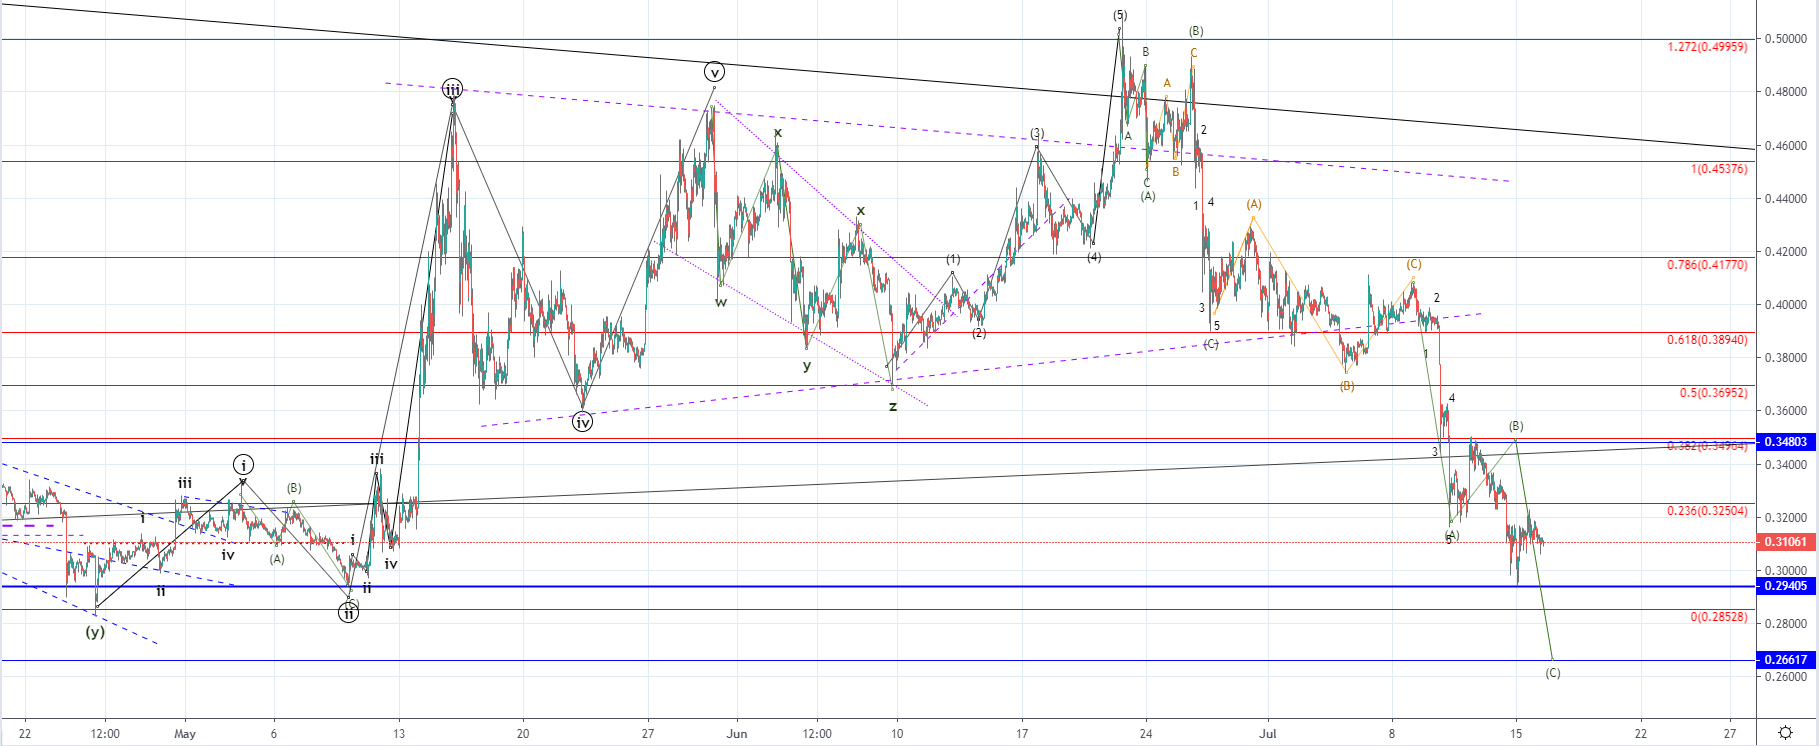 On yesterday’s low, the price spiked further to the downside for interaction with the significant horizontal level at $0.29405 where it found support as the price increased from there quickly leaving a wick on the hourly candle. Today, the price attempted to move to back to the 0.236 Fibonacci level but no interaction has been seen which can change later today if the price starts increasing again after a minor recovery.
The $0.29405 level is a highly significant support level but the price could retest the lower one at $0.26617 if we haven’t seen the completion of the third ABC to the downside. Prior to a breakout below the 0.236 Fib level, we have seen a five-wave impulse which is why the next move which was a retest of the 0.382 Fib level was considered as the B wave. But as the C wave is usually the equal or longer size than the A wave, further downside movement could be seen before its completion.
FXOpen offers the world's most popular cryptocurrency CFDs*, including Bitcoin and Ethereum. Floating spreads, 1:2 leverage — at your service. Open your trading account now or learn more about crypto CFD trading with FXOpen.
*At FXOpen UK and FXOpen AU, Cryptocurrency CFDs are only available for trading by those clients categorised as Professional clients under FCA Rules and Professional clients under ASIC Rules respectively. They are not available for trading by Retail clients.
This article represents the opinion of the Companies operating under the FXOpen brand only. It is not to be construed as an offer, solicitation, or recommendation with respect to products and services provided by the Companies operating under the FXOpen brand, nor is it to be considered financial advice.
Stay ahead of the market!
Subscribe now to our mailing list and receive the latest market news and insights delivered directly to your inbox.

Latest articles

Weekly Market Wrap With Gary Thomson: Nasdaq, EUR/USD, USD/CHF, Brent Crude Oil, Googl Shares
Get the latest scoop on the week's hottest headlines, all in one convenient video. Join Gary Thomson, the COO of FXOpen UK, as he breaks down the most significant news reports and shares his expert insights.
- Nasdaq Composite: Worst Session

Analysis of AUD/USD: Exchange Rate Falls to Early May Low
As indicated by the 4-hour AUD/USD chart today:
→ the rate fell below 0.652, a level last seen on May 2;
→ the RSI indicator dropped below 15, a level last seen during the panic over the spread of COVID-19

Analysis of AMZN Stock: Price at 1.5-Month Low
As shown in the AMZN chart, the stock price dropped below:
→ the psychological level of $180;
→ the mid-June interim low.
The last time AMZN traded below $180 was in early June.
Thus, AMZN has faced sell-offs, similar to other tech