


BTC and XRP - Recovery seen but it could still be corrective
FXOpen
BTC/USD
From yesterday’s low at $7775.2 the price of Bitcoin has increased to a significant horizontal level at $8500 today which is an increase of 9.38%. I was expecting that the level would serve as support on the way down, but the price continued moving below it which is why today we are seeing a retest of level for resistance. Currently, the price is being traded slightly lower at around $8357 as the price got rejected. 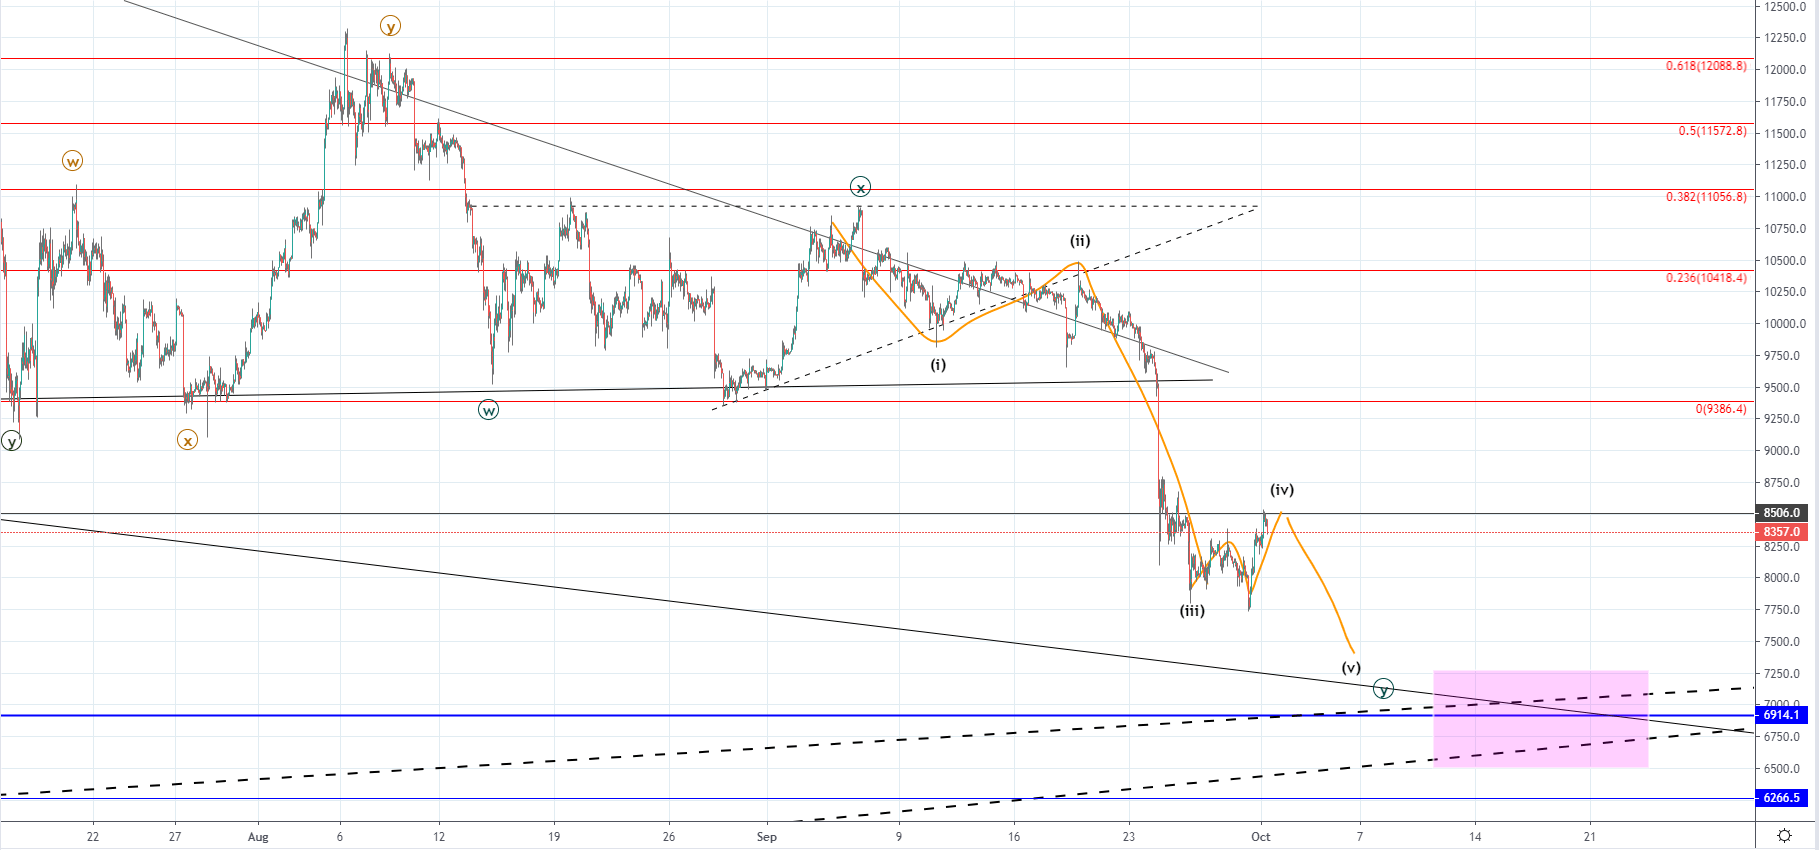 Looking at the hourly chart, you can see that after a breakout from the descending triangle the price continued moving to the downside and fell below the support level with strong momentum. As we are likely seeing the development of the Y wave from the 3rd WXY correction to the downside we are soon to see the completion of the downfall, and if the price is moving in a five-wave manner the recovery we’ve seen from yesterday could be the 4th wave, especially considering that it has developed in a three-wave manner which indicates corrective structure .
As the price has retested the level and is looking like it found resistance we could now see another drop starting which would be the 5th wave. If this is true then the price would soon start another move to the downside potentially ending at around $7389 but as it approaches the vicinity of the significant support intersection it might move a bit further to the downside to around $7000 as a retest of the support point.
Another possibility would be that the Y wave developed in which case yesterday’s low would be its lowest point and with the recovery seen being its first recovery wave. But as the momentum was strong on the way down I don’t believe that’s likey. This will be confirmed by the $8500 level as if the price continues moving above it, it could mean that the recovery started.
XRP/USD
The price of Ripple has decreased by 30.19% from the 18th of September when it spiked to it’s highest at $0.32504 measured to the last Tuesday’s low at $0.22725. From there we’ve seen a recovery starting to develop with the price reaching around $0.26138 today which is a recovery of 14.72%.
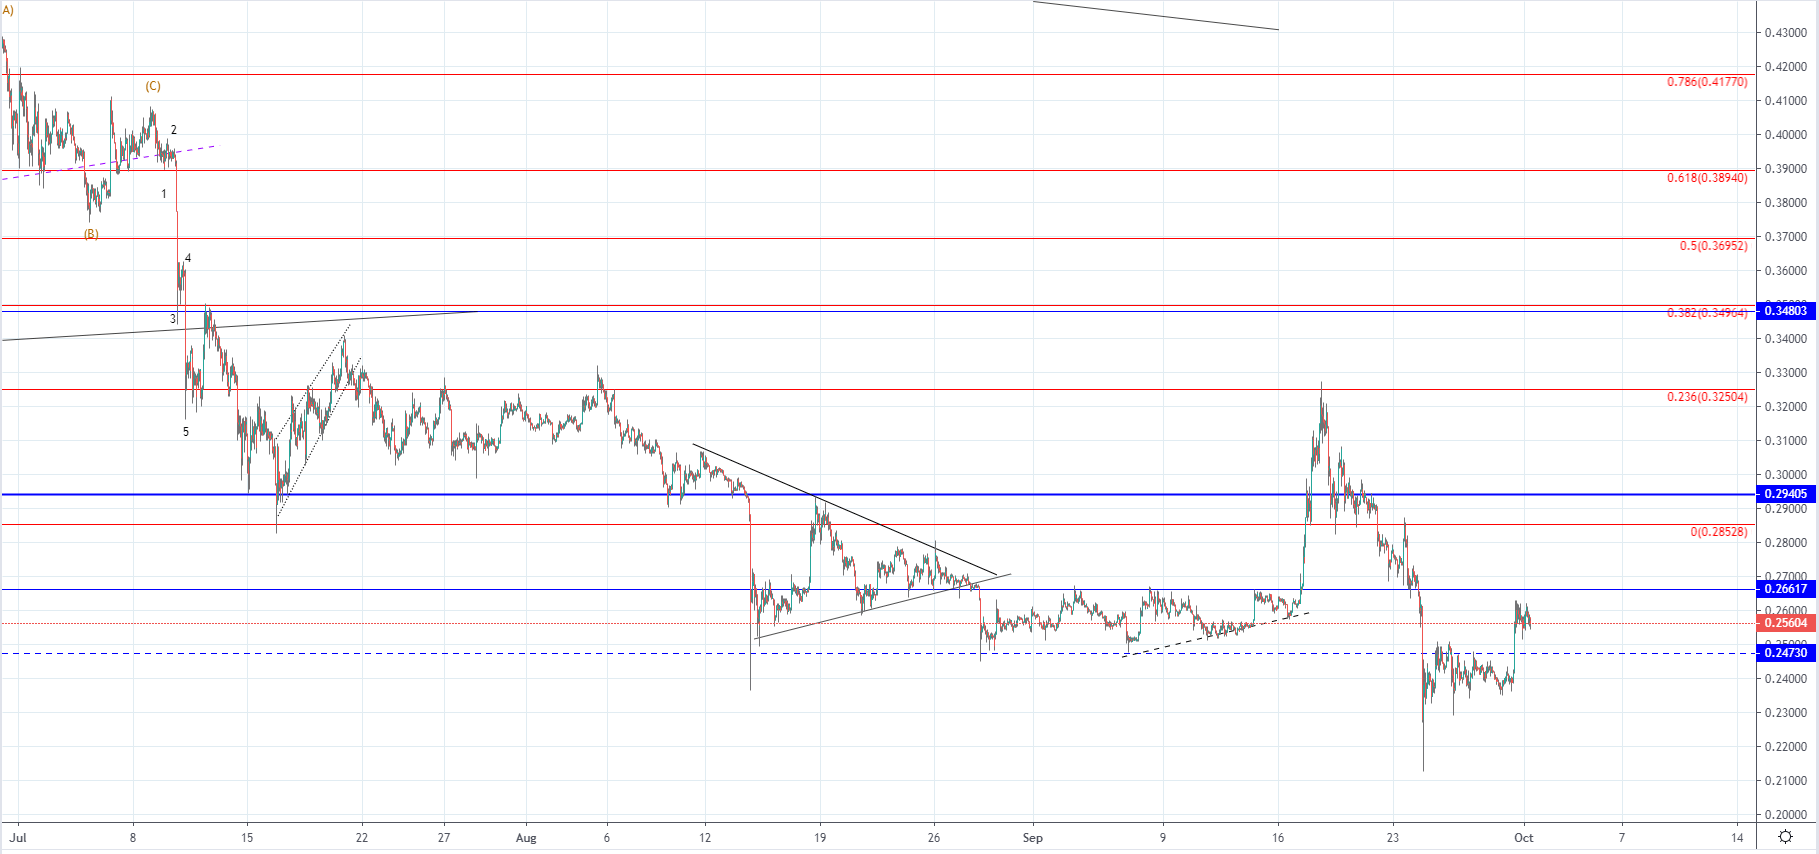 On the hourly chart, you can see that the price came down below the lower horizontal level on the previous downfall which was the support level from the horizontal range in which the price has been consolidating after the mentioned spike to the upside. This strong bearish momentum had led the price into the buyer’s territory which is why buying was activated but considering the vicinity of the upper horizontal level which now serves as resistance, it is unclear whether or not the increase would continue.
If we see the price move above the $0.26617 level the increase will likely continue, but if the price interacts with the level and finds resistance there further depreciation could be expected.
FXOpen offers the world's most popular cryptocurrency CFDs*, including Bitcoin and Ethereum. Floating spreads, 1:2 leverage — at your service (additional fees may apply). Open your trading account now or learn more about crypto CFD trading with FXOpen.
*Important: At FXOpen UK, Cryptocurrency trading via CFDs is only available to our Professional clients. They are not available for trading by Retail clients. To find out more information about how this may affect you, please get in touch with our team.
This article represents the opinion of the Companies operating under the FXOpen brand only. It is not to be construed as an offer, solicitation, or recommendation with respect to products and services provided by the Companies operating under the FXOpen brand, nor is it to be considered financial advice.
Stay ahead of the market!
Subscribe now to our mailing list and receive the latest market news and insights delivered directly to your inbox.


Latest articles

USD/JPY and USD/CHF Near Key Levels: The Dollar Supported by the Fed
The US dollar continues to trend upwards following the Federal Reserve meeting, drawing support from the regulator’s moderately hawkish stance and comments by Jerome Powell. Markets interpret the Fed’s rhetoric as a signal that restrictive policy is likely

EUR/USD and GBP/USD consolidate ahead of the Fed decision
European currencies are showing subdued dynamics, entering a consolidation phase following their previous advance. Earlier, EUR/USD and GBP/USD broke out of their ranges and strengthened; however, the subsequent correction has led both pairs to retest the previously breached

Meta: V-Shaped Recovery Meets Heavy Volume Resistance
The movement in Meta Platforms shares is being driven by two competing narratives. On one hand, advertising revenue is benefiting from AI-based tools: the Advantage+ platform continues to support strong advertiser demand, and the analyst consensus for Q1 2026 revenue