


BTC and XRP - Retracement Expected
FXOpen
BTC/USD
The price of Bitcoin has increased by around 10% from last Friday when it was sitting at $7712 at it’s lowest point as it came up to $8536 at it’s highest today. The price is currently sitting at $8493 as it reached its key horizontal level at $8506 and is retesting it from the downside.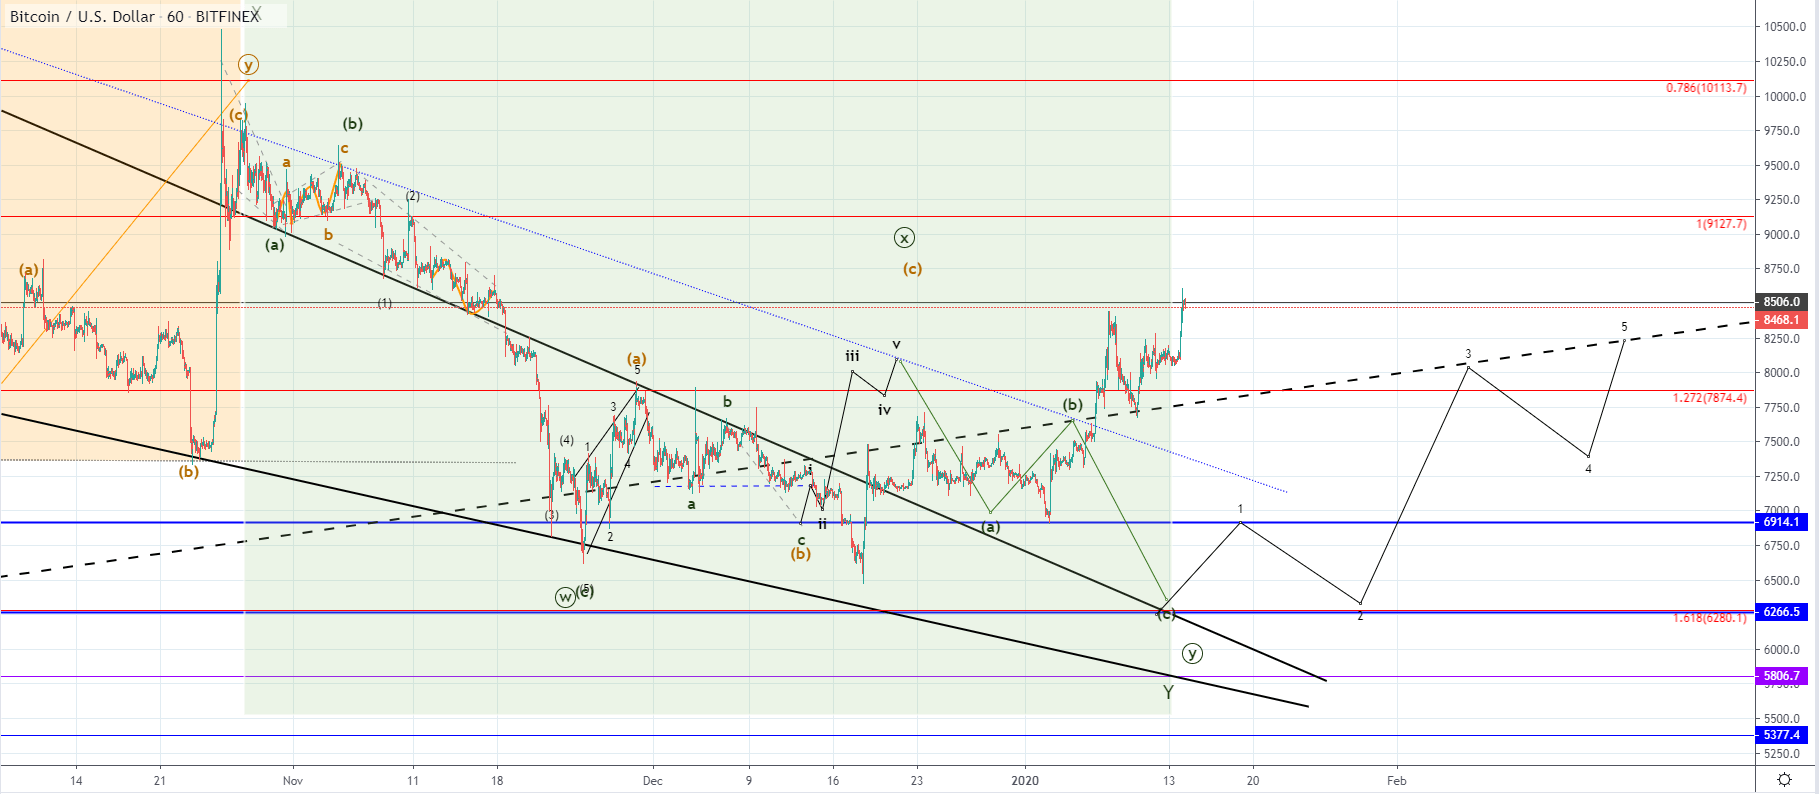 Looking at the hourly chart, you can see that this increase was expected after a retest of the prior low in a five-wave manner which was presumed to be the C wave out of the next ABC to the upside out of which the A wave was presumed to be the leading diagonal we have seen in the second half of December.
This means that the recovery since the start of the year is considered a corrective increase after which further lows could be seen, potentially to the lower horizontal support level at $6266, or even lower at $5800. This is because we are most likely seeing the X wave from the last WXY of a higher degree so this second wave could, in theory, it could continue moving further to the upside before another downturn starts. But as the price reached its significant horizontal resistance and is now retesting it we are likely to see a rejection leading the price into a minor retracement.
From the depth of the retracement, we are going to evaluate the possibilities of both potential scenarios.
XRP/USD
The price of Ripple has also followed the market and increased significantly since the start of the year coming from $0.18542 on the 3rd to $0.226 on the 6th but fell back below to $0.2 on the 10th. From there we have seen another round of interest as the price increased by 12% as it came up to $0.22483 at its highest point today, coming to the previous high vicinity.
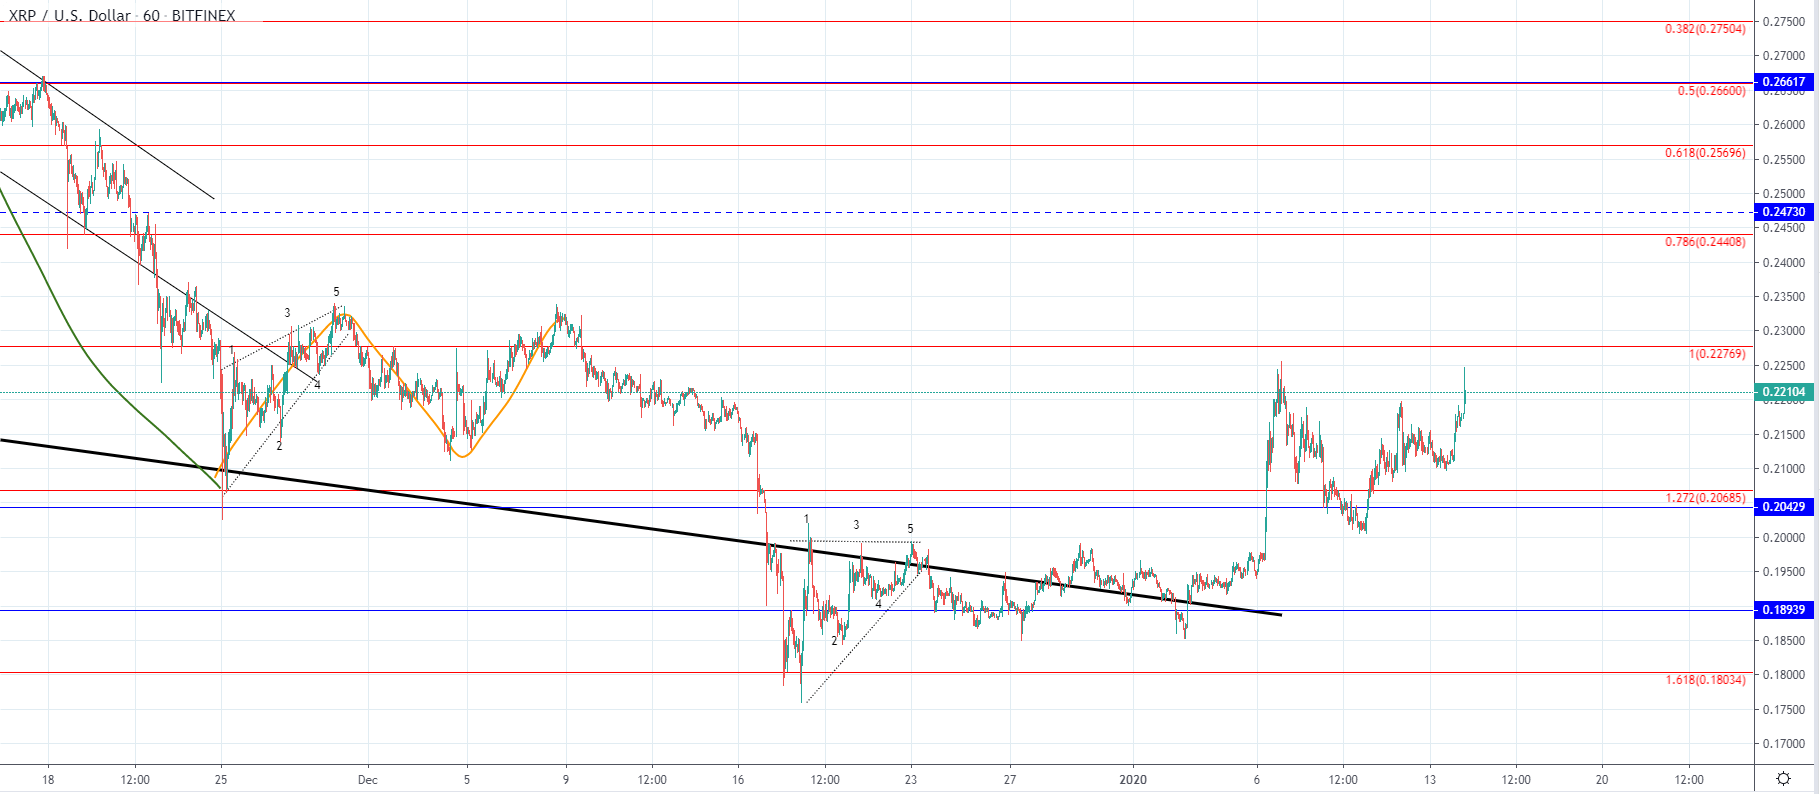 On the hourly chart, you can see that the price found support at the significant level intersection between the descending trendline and the horizontal support level at $0.1893 from where the price increased exponentially moving in a parabolic manner. As this resulted in a recovery of over 21% it indicates bullishness but we could be still seeing a corrective recovery like in the case of Bitcoin before further lows are established.
Another possibility would be that the price of Ripple bottomed out at the mentioned low and is now starting a higher degree bullish uptrend in which case the currently seen increase is to continue pushing the price above the previous high and potentially above the 1 Fibonacci level which would confirm this assumption.
FXOpen offers the world's most popular cryptocurrency CFDs*, including Bitcoin and Ethereum. Floating spreads, 1:2 leverage — at your service (additional fees may apply). Open your trading account now or learn more about crypto CFD trading with FXOpen.
*Important: At FXOpen UK, Cryptocurrency trading via CFDs is only available to our Professional clients. They are not available for trading by Retail clients. To find out more information about how this may affect you, please get in touch with our team.
This article represents the opinion of the Companies operating under the FXOpen brand only. It is not to be construed as an offer, solicitation, or recommendation with respect to products and services provided by the Companies operating under the FXOpen brand, nor is it to be considered financial advice.
Stay ahead of the market!
Subscribe now to our mailing list and receive the latest market news and insights delivered directly to your inbox.


Latest articles

DAX 40: consolidation amid technology sell-off
A wave of selling in the technology sector that emerged earlier this week has weighed on European equities. The trigger was investor concern over the profitability of large-scale debt-funded investments by major US tech companies in AI infrastructure. The Nasdaq

Euro Hits Fresh Yearly Lows Amid Dovish ECB Signals
The euro remains under pressure following weak macroeconomic data from the euro area and fresh signals that the European Central Bank is prepared to maintain a more accommodative monetary policy stance. Data released yesterday pointed to a deterioration in business

Pound at Key Levels: Markets Assess Impact of Political Uncertainty in the UK
The British pound remains under pressure following increased political uncertainty in the United Kingdom triggered by the Prime Minister’s resignation. Investors are assessing potential shifts in the political and economic policy outlook after the head of government stepped down,