


BTC and XRP - Significant moves ahead
FXOpen

BTC/USD
The price of Bitcoin has been increasing from last Monday when it was sitting at $21,860 and came up to $28,357 on Sunday which was an increase of around 30%. Since then we have seen a pullback to $25,811 at its lowest spike but both times the price snapped back above $26,213. At the moment it is being traded at $26,829 and is moving sideways.
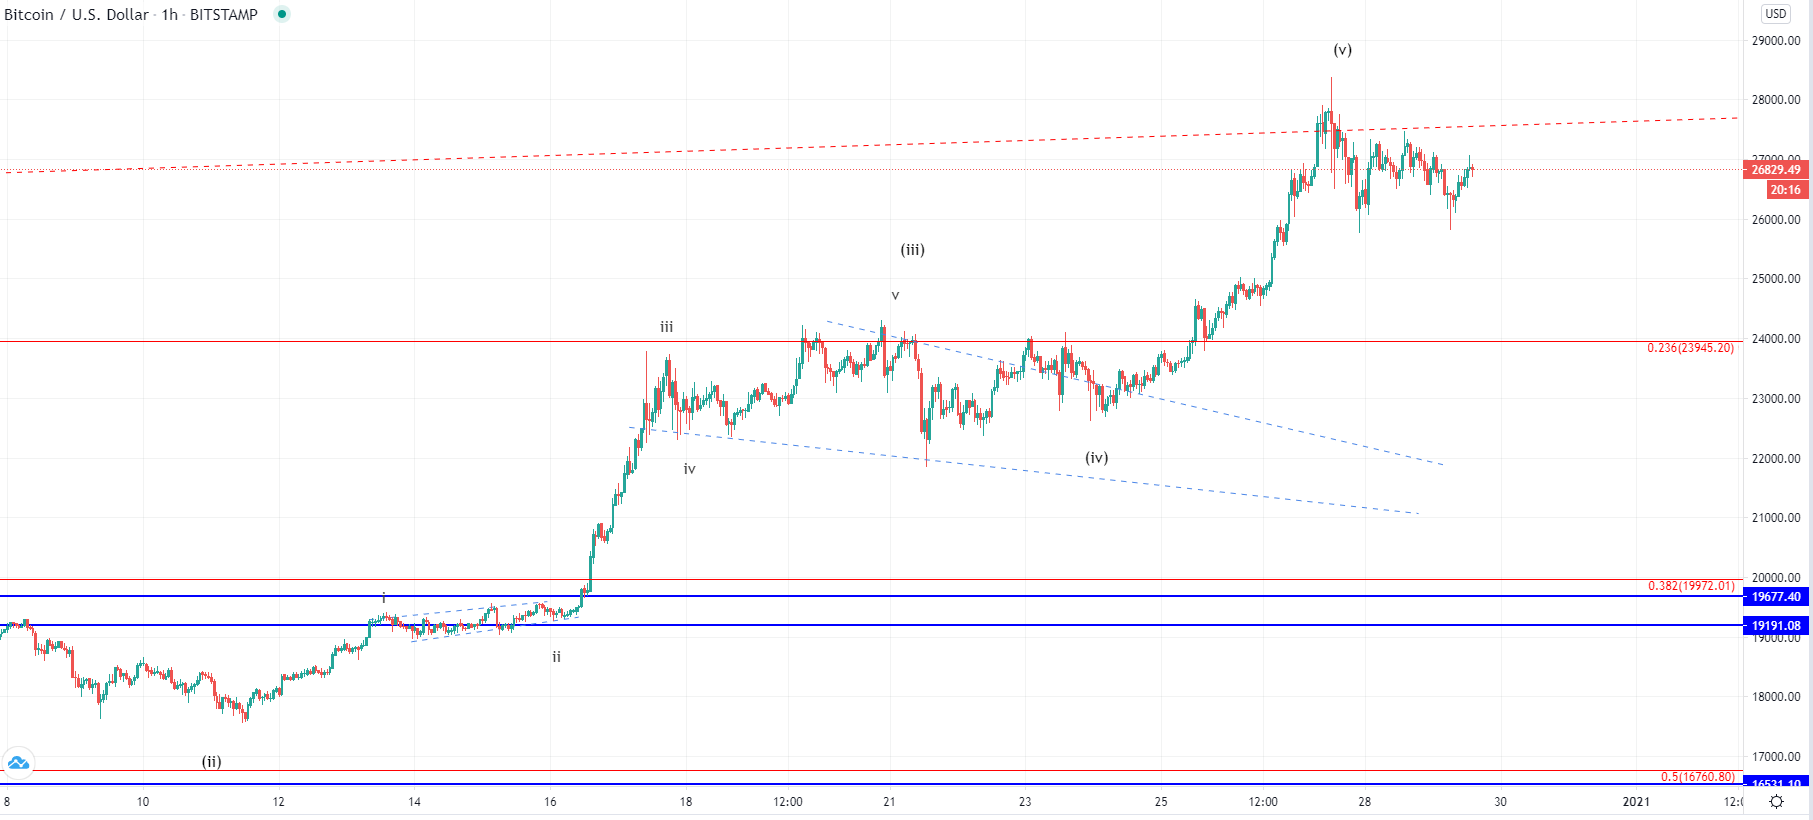
Looking at the hourly chart, you can see that the price made a new all-time high on Sunday as it came above the $24,000 level and broke the resistance there. The increase seen from last Monday is the ending, 5th wave, out of the higher degree impulse which is why we could soon expect the start of a downturn. But considering that now we are seeing a corrective decline it could very well indicat that the higher degree descending move has already started.
If we see the price start moving back up and above the prior local high at $27,252 it could serve as an early indication that a higher high to the $30,000 level is coming for one more higher high before the completion of this ending wave. But if the price makes an impulsive descending move and falls back to the 0.236 Fib level of the prior resistance, that would most likley validate the coming correction of the higher degree.
XRP/USD
From last Monday when the price of Ripple was sitting at $0.5569 we have seen a decrease of 65.77% as it came down to $0.1906 at its lowest point today. The price fell sharply and impulsively after breaking the $0.5532 horizontal area and fell below the prior significant support zone.
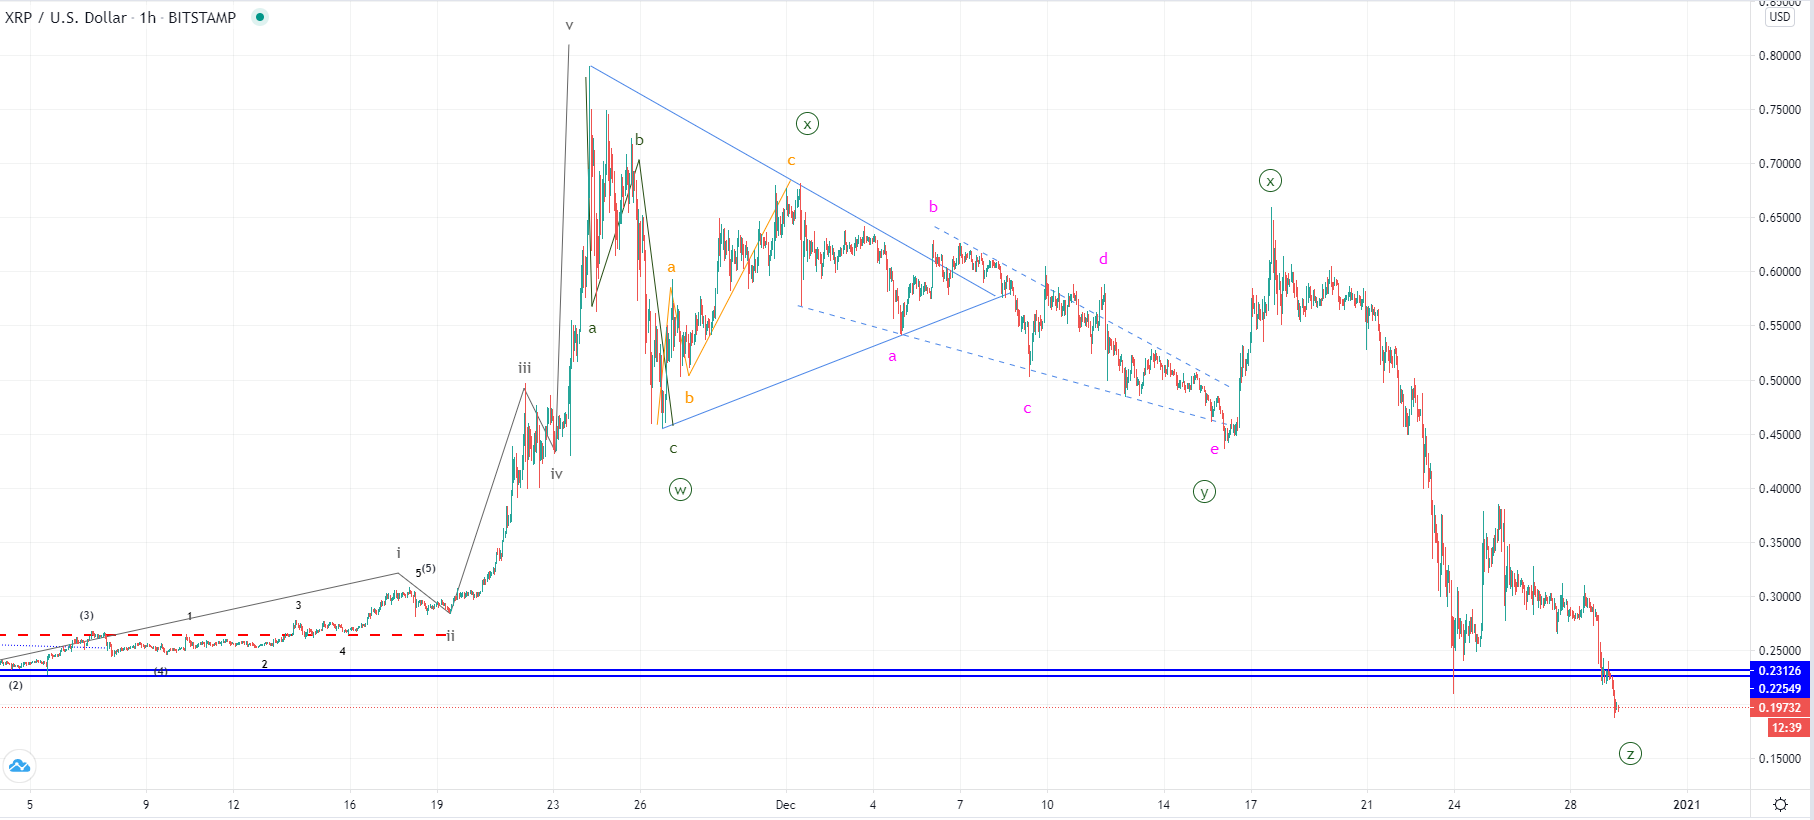
On the hourly chart, we can see that the price has developed its 5th wave to the downside which validated the prior assumption that the increase that ended at $0.66 was the second wave X out of the complex correction count. As the current downside move made from the 25th of December is a lower degree 5th wave the decrease would be expected to end soon. There could be further testing of support around the current levels as the price pirced the significant support around around $0.23 so its surpasing to the upside could be an indcation that the recovery started.
Further decline could follow before a significant recovery as the seller’s have shown extreme force so before buyers can exibit any significance the seller’s pressure has to be stopped out.
FXOpen offers the world's most popular cryptocurrency CFDs*, including Bitcoin and Ethereum. Floating spreads, 1:2 leverage — at your service (additional fees may apply). Open your trading account now or learn more about crypto CFD trading with FXOpen.
*Important: At FXOpen UK, Cryptocurrency trading via CFDs is only available to our Professional clients. They are not available for trading by Retail clients. To find out more information about how this may affect you, please get in touch with our team.
This article represents the opinion of the Companies operating under the FXOpen brand only. It is not to be construed as an offer, solicitation, or recommendation with respect to products and services provided by the Companies operating under the FXOpen brand, nor is it to be considered financial advice.
Stay ahead of the market!
Subscribe now to our mailing list and receive the latest market news and insights delivered directly to your inbox.


Latest articles

DAX 40: consolidation amid technology sell-off
A wave of selling in the technology sector that emerged earlier this week has weighed on European equities. The trigger was investor concern over the profitability of large-scale debt-funded investments by major US tech companies in AI infrastructure. The Nasdaq

Euro Hits Fresh Yearly Lows Amid Dovish ECB Signals
The euro remains under pressure following weak macroeconomic data from the euro area and fresh signals that the European Central Bank is prepared to maintain a more accommodative monetary policy stance. Data released yesterday pointed to a deterioration in business

Pound at Key Levels: Markets Assess Impact of Political Uncertainty in the UK
The British pound remains under pressure following increased political uncertainty in the United Kingdom triggered by the Prime Minister’s resignation. Investors are assessing potential shifts in the political and economic policy outlook after the head of government stepped down,