


FXOpen

BTC/USD
The price of Bitcoin has recovered significantly from Sunday’s low of around $32,000 as it made an increase of 27% measured to its highest point today at $39.723. Since then we have seen a minor pullback with the price currently being traded at $37,896 and moving to the downside again.
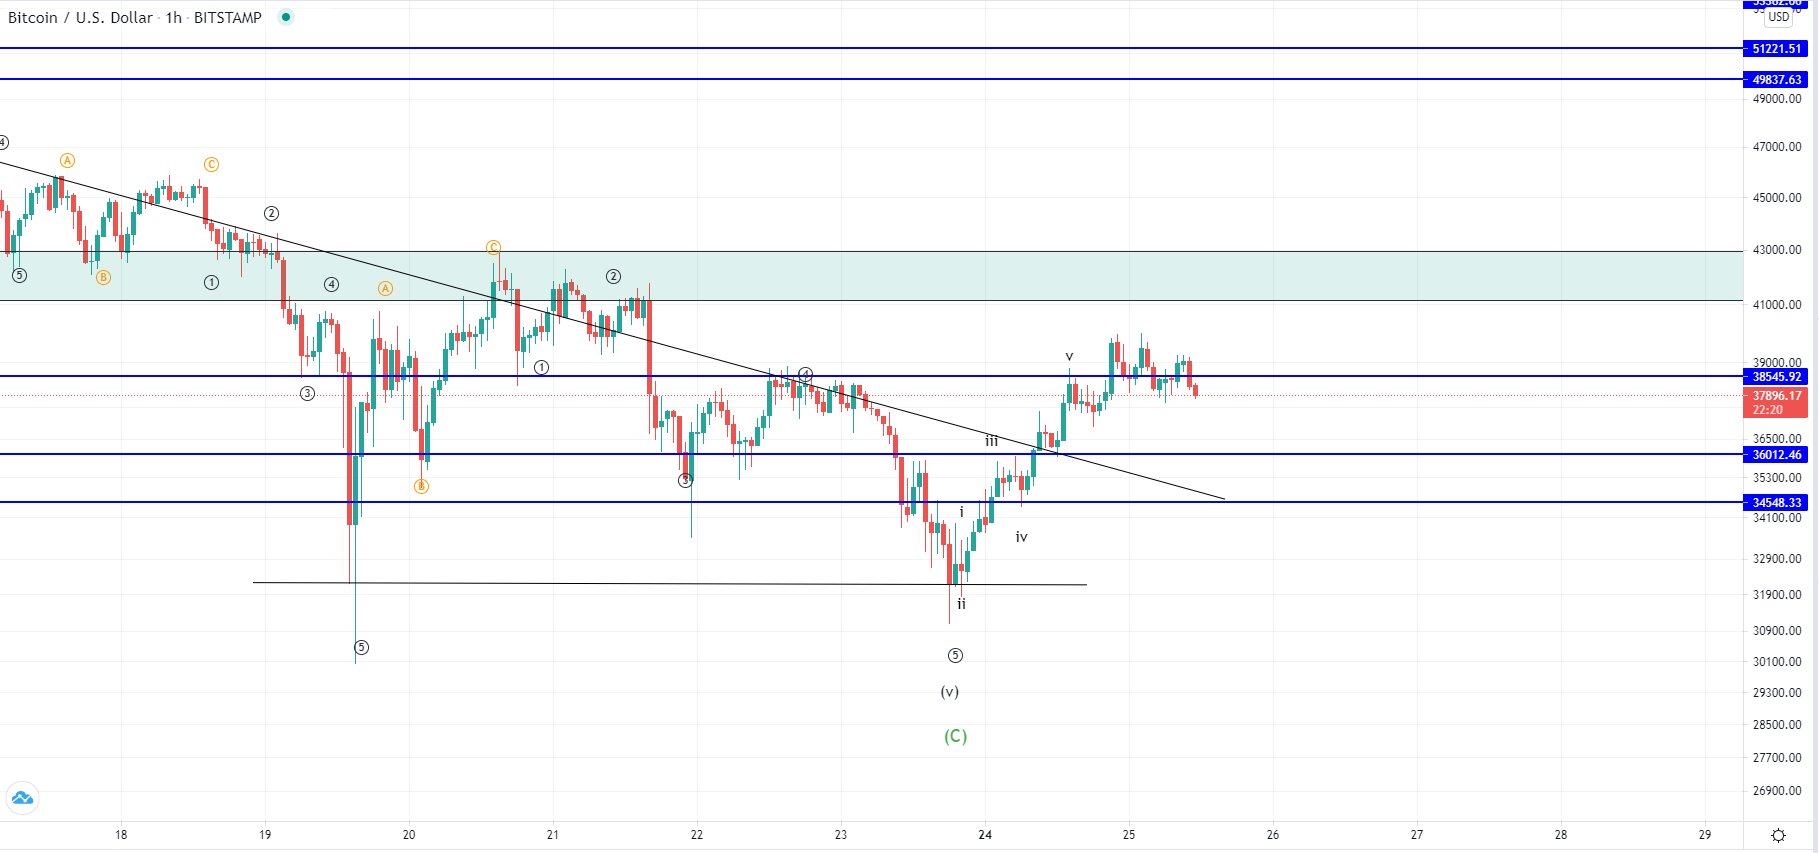
On the hourly chart, you can see that the price made a five-wave increase from Sunday and came slightly above the significant horizontal level that served as support now turned resistance. This is why the price struggled to keep up its upward trajectory and is now headed to the downside again.
From Sunday we have most likely seen the start of the next move to the upside as the corrective ABC of the highest degree ended. If this is true, then we are now seeing the first sub-wave of the next five-wave impulse coming to completion as is why the currently seen downside move would be expected to continue pushing the price further down. That would be expected to develop as the 2nd sub-wave of the higher degree count and it should now form a higher low compared to Sunday’s one, potentially around $36,000 where the next horizontal support is in line. But from there further upside movement would be expected and a breakout above the $42,000 horizontal zone.
XRP/USD
Ripple has shown a recovery of 57% from Sunday’s low of $0.66 to $1.05 at its high today. But like in the case of Bitcoin is now making a consolidation move that is likely to continue pushing the price lower.
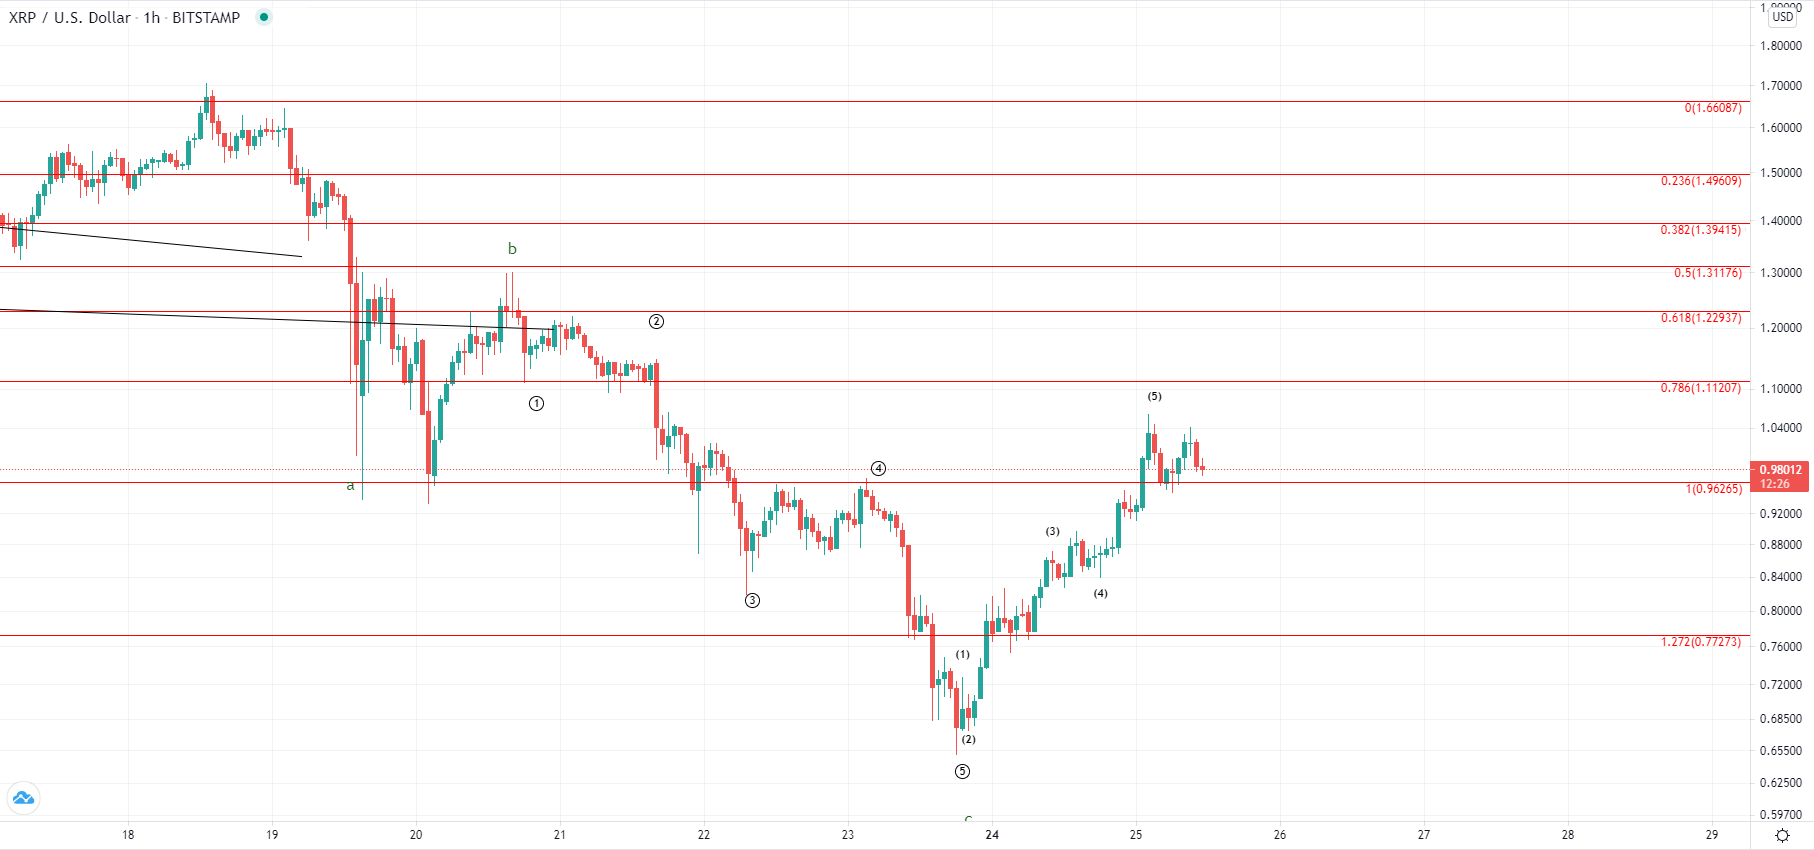
It is still sitting above the 1 Fib level which is a good sign but if the price ended its five-wave move it would now be expected to fall back down to potentially around $0.84 area where the next support level is or even further down to the 1.272 Fib level area. There is a possibility that a higher high might come first if the five-wave impulse from Sunday hasn’t been completed but in either way, a retracement would be expected afterward as the 2nd sub-wave of the developing structure.
If the price ended its higher degree correction on Sunday, the increase seen from there is the starting impulse wave to the upside which would significantly recover the price in the upcoming period.
This forecast represents FXOpen Markets Limited opinion only, it should not be construed as an offer, invitation or recommendation in respect to FXOpen Markets Limited products and services or as financial advice. Cryptocurrency CFDs are not available to trade in all jurisdictions.
FXOpen offers the world's most popular cryptocurrency CFDs*, including Bitcoin and Ethereum. Floating spreads, 1:2 leverage — at your service. Open your trading account now or learn more about crypto CFD trading with FXOpen.
*At FXOpen UK and FXOpen AU, Cryptocurrency CFDs are only available for trading by those clients categorised as Professional clients under FCA Rules and Professional clients under ASIC Rules respectively. They are not available for trading by Retail clients.
This article represents the opinion of the Companies operating under the FXOpen brand only. It is not to be construed as an offer, solicitation, or recommendation with respect to products and services provided by the Companies operating under the FXOpen brand, nor is it to be considered financial advice.
Stay ahead of the market!
Subscribe now to our mailing list and receive the latest market news and insights delivered directly to your inbox.

Latest articles

Weekly Market Wrap With Gary Thomson: Nasdaq, EUR/USD, USD/CHF, Brent Crude Oil, Googl Shares
Get the latest scoop on the week's hottest headlines, all in one convenient video. Join Gary Thomson, the COO of FXOpen UK, as he breaks down the most significant news reports and shares his expert insights.
- Nasdaq Composite: Worst Session

Analysis of AUD/USD: Exchange Rate Falls to Early May Low
As indicated by the 4-hour AUD/USD chart today:
→ the rate fell below 0.652, a level last seen on May 2;
→ the RSI indicator dropped below 15, a level last seen during the panic over the spread of COVID-19

Analysis of AMZN Stock: Price at 1.5-Month Low
As shown in the AMZN chart, the stock price dropped below:
→ the psychological level of $180;
→ the mid-June interim low.
The last time AMZN traded below $180 was in early June.
Thus, AMZN has faced sell-offs, similar to other tech