


BTC and XRP - Still in a decline which is most likely a corrective one
FXOpen
BTC/USD
From yesterday’s open at $9095 the price of Bitcoin has depreciated in value by 5.25% as it came to $8617 at its lowest point around which the price is currently being traded today.
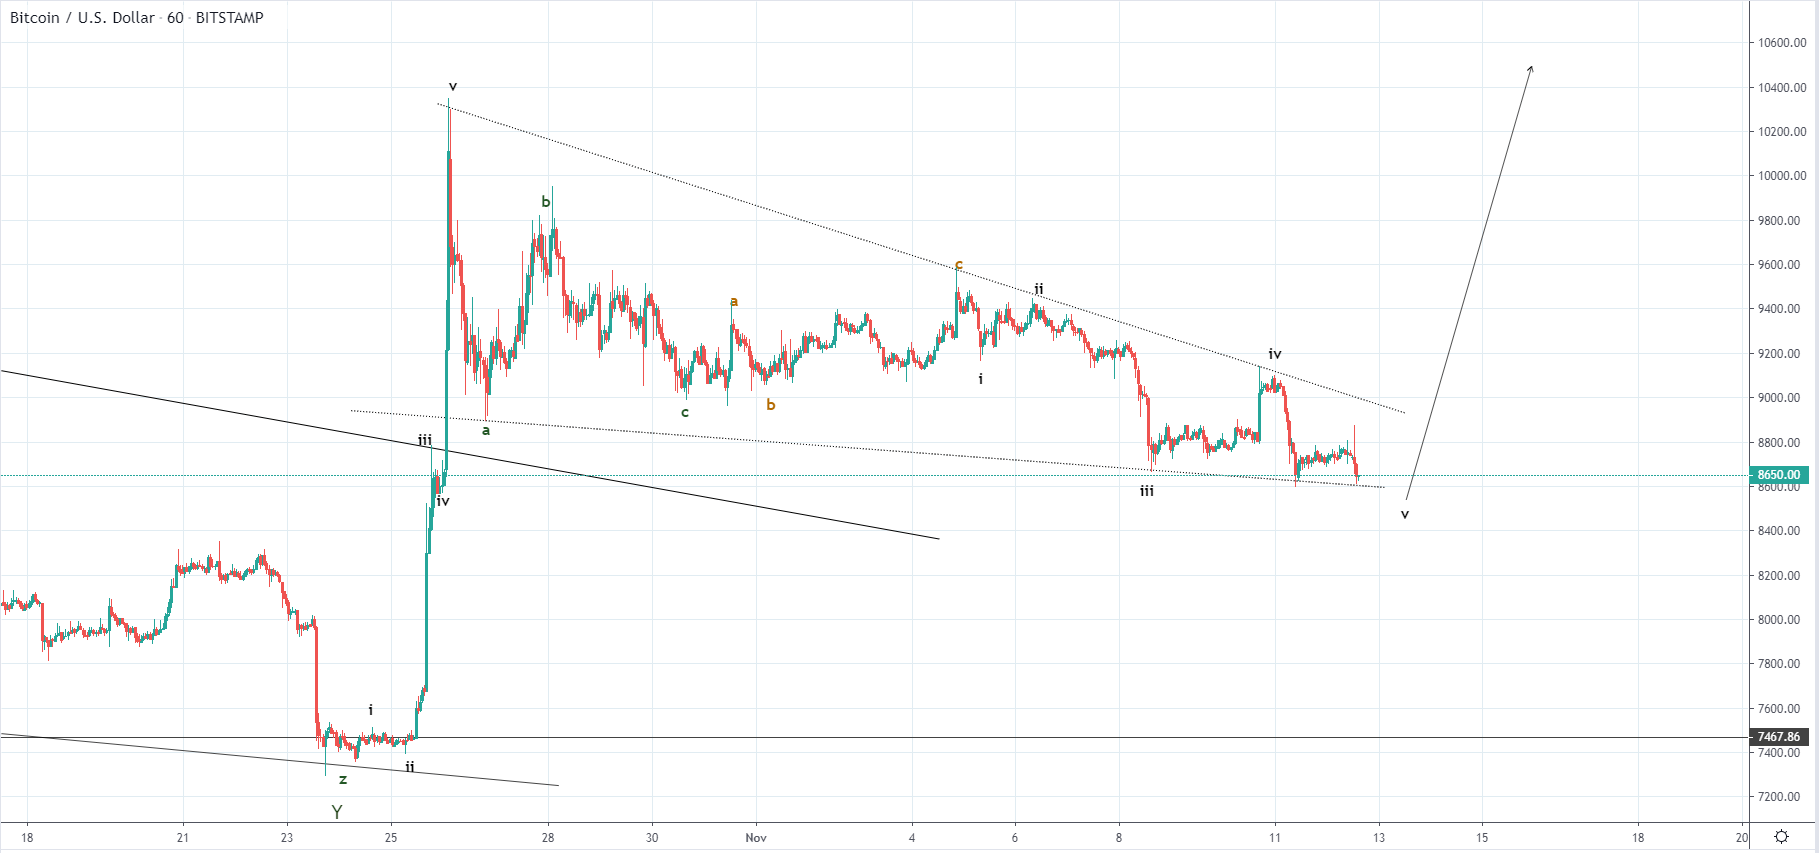 Looking at the hourly chart we can see that the price is retesting the descending triangle's support level. As the price is in a downward trajectory we could see a further decline but considering that we have seen an impulsive wave prior to the formation of the descending triangle it is most likely corrective in nature which is why I would be expecting an uptrend continuation after the decline ends.
We have seen an ABC to the downside followed by a three-wave move to the upside and now a five-wave move the downside again which is considered the third structure out of the higher degree count which is developing in a five-wave manner. This brings this corrective structure to be a higher degree ABC which is why I would be expecting that the price would hold above the triangle’s support level.
The expected increase could be either the 3rd wave from the five-wave move to the upside or it could be a C wave from another corrective increase in which case after its completion we could see a lower low compared to the Y wave of the higher degree count which ended at around $7378.
XRP/USD
From last Thursday when the price of Ripple reached its high at $0.31222 measured to the current level at $0.2703 we have seen a decrease of 13.58. The price is still in a decline and is getting close to the vicinity of the prior low and the horizontal support level at $0.26617 so we could see interaction with the level before an upturn.
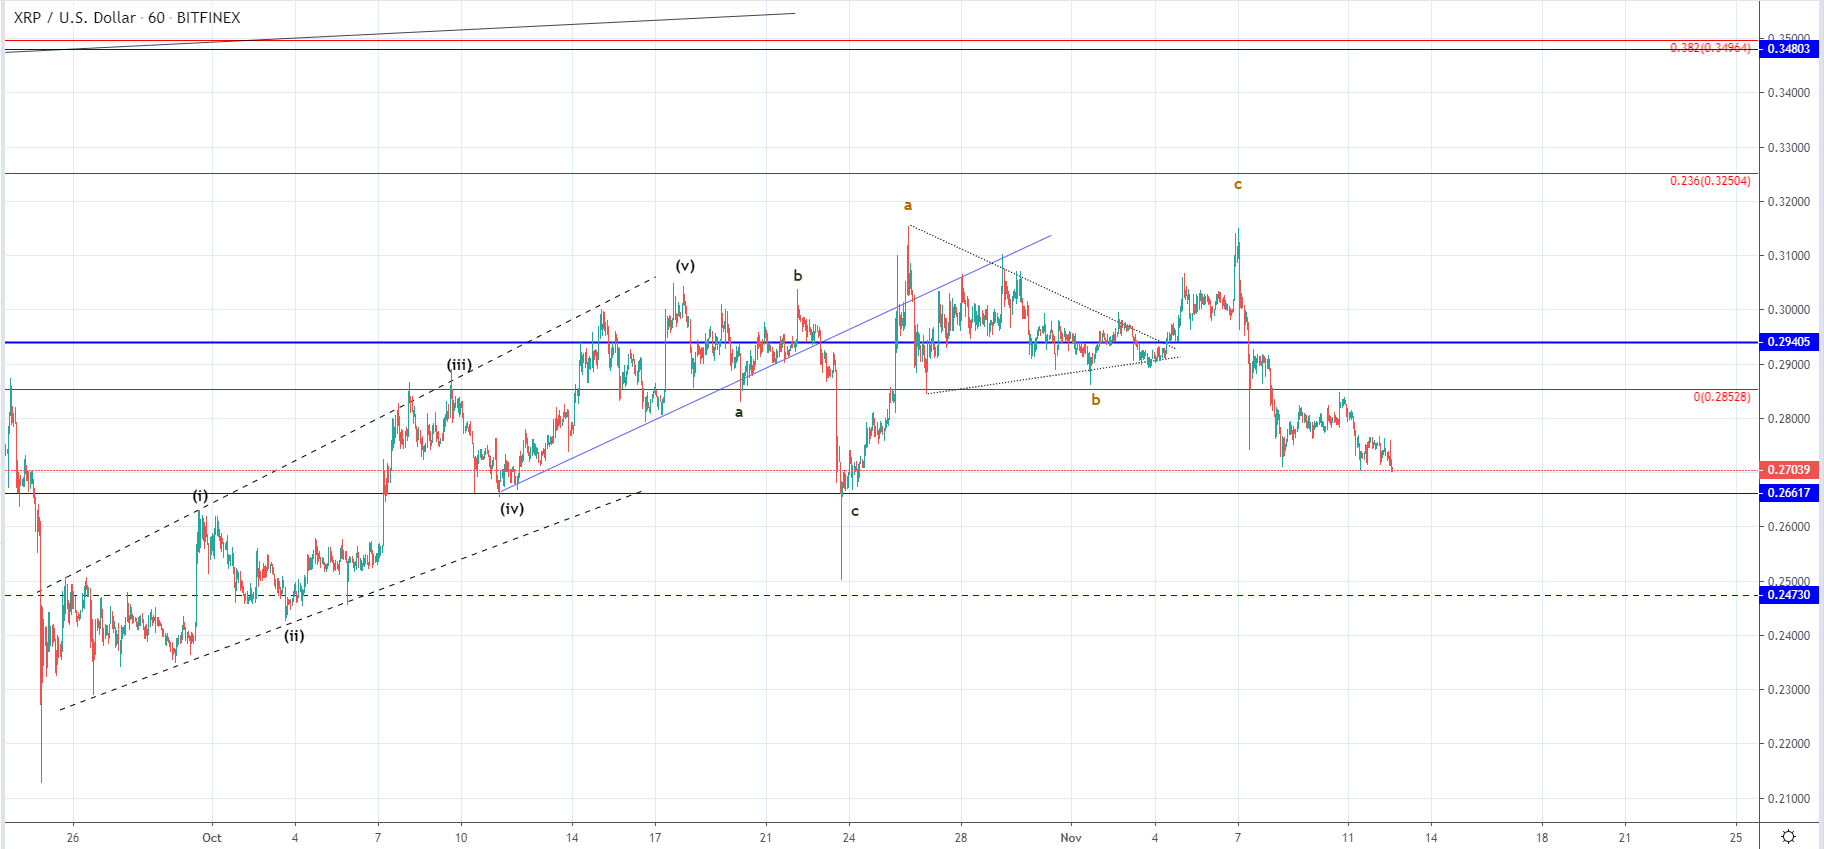 On the hourly chart, we can see that the price is in a decline after another ABC correction to the upside ended but the wave structure is impinging impulsiveness. From the 26th of October when the price was sitting at its lowest in while we have seen a five-wave increase inside an ascending channel after which two corrective structures developed. This means that the current downfall could be the 3rd structure out of the higher degree correction.
If this is true, then after the decline ends we are to see further uptrend continuation and as the price is approaching the significant horizontal support we are soon going to get the needed validation.
FXOpen offers the world's most popular cryptocurrency CFDs*, including Bitcoin and Ethereum. Floating spreads, 1:2 leverage — at your service (additional fees may apply). Open your trading account now or learn more about crypto CFD trading with FXOpen.
*Important: At FXOpen UK, Cryptocurrency trading via CFDs is only available to our Professional clients. They are not available for trading by Retail clients. To find out more information about how this may affect you, please get in touch with our team.
This article represents the opinion of the Companies operating under the FXOpen brand only. It is not to be construed as an offer, solicitation, or recommendation with respect to products and services provided by the Companies operating under the FXOpen brand, nor is it to be considered financial advice.
Stay ahead of the market!
Subscribe now to our mailing list and receive the latest market news and insights delivered directly to your inbox.


Latest articles

USD/JPY and USD/CHF Near Key Levels: The Dollar Supported by the Fed
The US dollar continues to trend upwards following the Federal Reserve meeting, drawing support from the regulator’s moderately hawkish stance and comments by Jerome Powell. Markets interpret the Fed’s rhetoric as a signal that restrictive policy is likely

EUR/USD and GBP/USD consolidate ahead of the Fed decision
European currencies are showing subdued dynamics, entering a consolidation phase following their previous advance. Earlier, EUR/USD and GBP/USD broke out of their ranges and strengthened; however, the subsequent correction has led both pairs to retest the previously breached

Meta: V-Shaped Recovery Meets Heavy Volume Resistance
The movement in Meta Platforms shares is being driven by two competing narratives. On one hand, advertising revenue is benefiting from AI-based tools: the Advantage+ platform continues to support strong advertiser demand, and the analyst consensus for Q1 2026 revenue