


FXOpen
BTC/USD
From last Tuesday when the price of Bitcoin came down to $9833 at its lowest point we have seen an increase of 30% measured to the highest point the price has been today which is at $12814. The price is currently being traded at $12348 and even spiked further down to $12119 at its lowest point today.
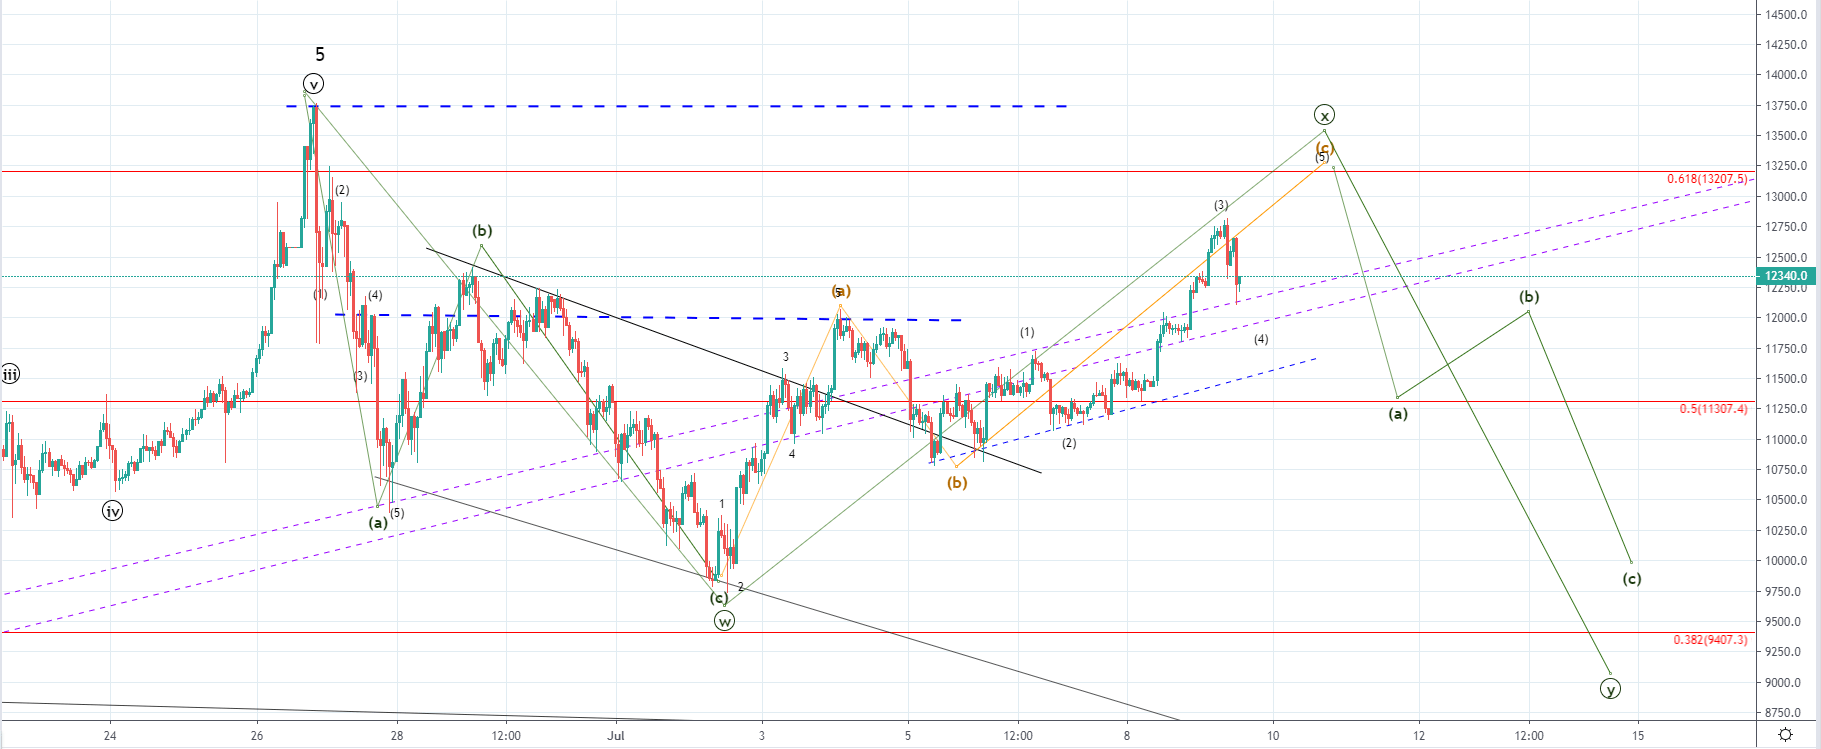 Looking at the hourly chart you can see that the price of Bitcoin came up above the ascending trendline zone which served as resistance on the way up and has retested it on today’s spike to the downside and found support there which indicates that the trendline zone is still serving as a significant pivot point. The price came down last Tuesday in a three-wave manner after which a five-wave increase has been seen forming a lower high with the price going below the ascending range and the 0.5 Fibonacci level.
As the price found support around the descending resistance level it started increasing again. I believed that the price is going to retest the upper ascending level before continuing to move to the downside again as the descending channel which started forming form 28th of June looked like it could be the 2nd wave out of the higher degree correction. But as the price increased with strong bullish momentum above the ascending range we could be seeing another ABC correction to the upside which would be the wave X out of the mentioned higher degree correction.
Another possibility would be that the ABC to the downside which ended last Tuesday was the end of the correction with the 30% increase seen after being the start of the next impulsive move to the upside, but I don’t believe that’s likely because according to my count the 5th wave of the Minor count ended on the yearly high at $13740.
As the price is in an upward trajectory in the upcoming period I would be expecting an interaction with the 0.618 Fib level or a retest of the yearly high before another downfall potentially below the 0.382 Fib or slightly above it, to around the vicinity of the last Tuesday’s low.
XRP/USD
From Friday’s low at $0.37812 the price of Ripple has increased by 7.71% measured to its highest point today which was at $0.4072 but fell down to $0.39591 where it’s currently being traded.
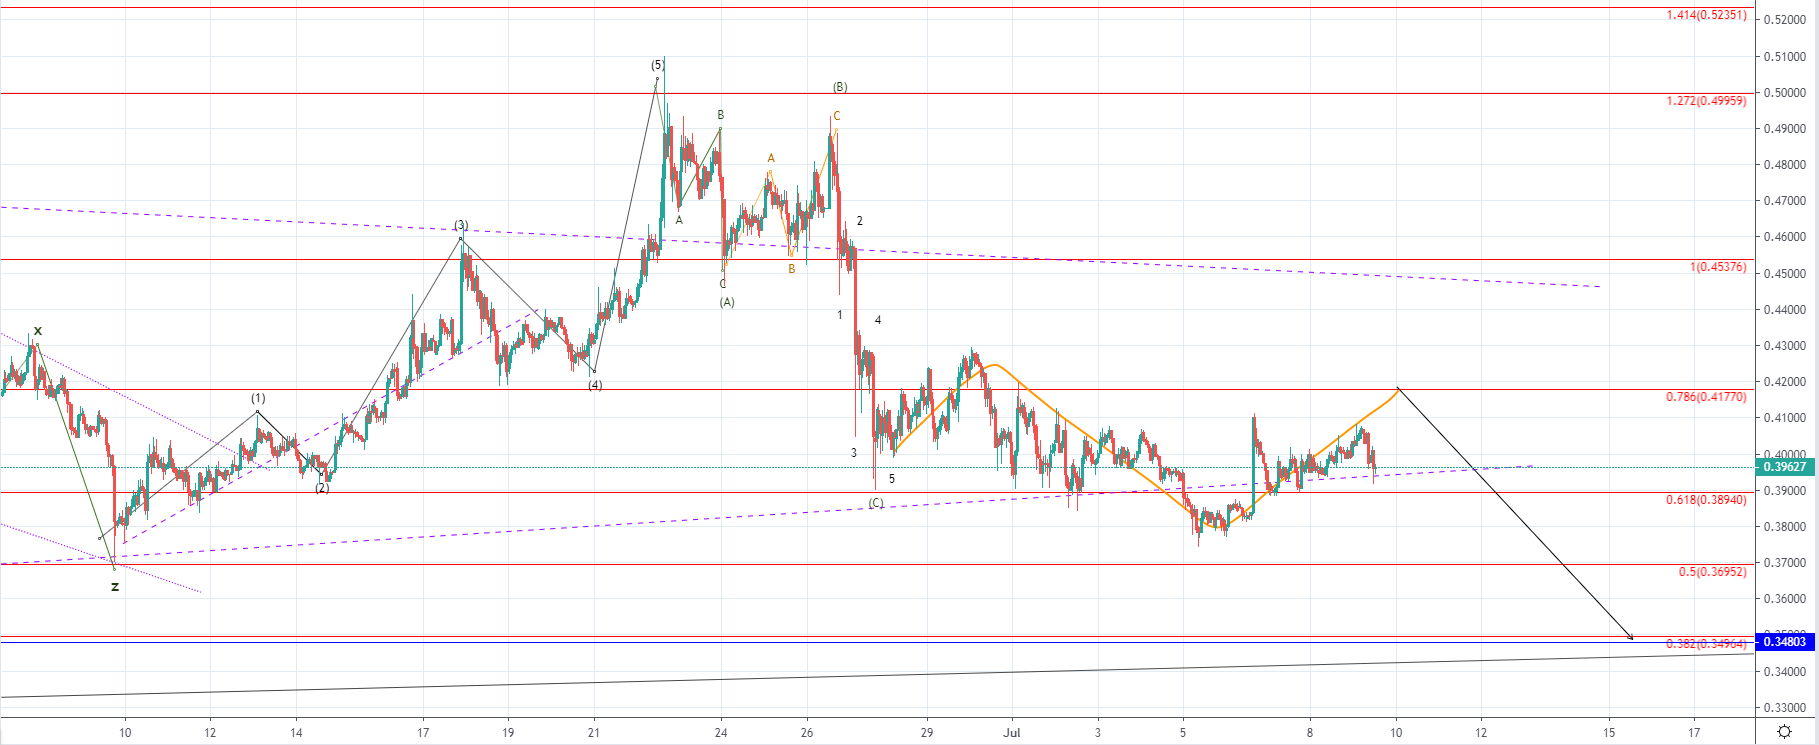 Looking at the hourly chart, you can see that the price of Ripple came above the ascending trendline which was the unconfirmed support from the symmetrical triangle which started forming from the 23rd of May and above the 0.618 Fib level which now serves as support as it was retested after a breakout. The price came up today to the vicinity of the breakout spike and got rejected by the resistance found there but found support at the ascending trendline.
A further increase would be expected for interaction with the 0.786 Fib level as we are most likely seeing a three wave correction to the upside which is set to end on a lower high compared to the one which ended slightly above the 0.786 Fibonacci level on the 30th of June. As we’ve seen the completion of the five-wave impulse as an interaction with the 1.272 Fib level and an ABC to the downside this structure is most likely the past of the same correction of a higher degree and would, in that case, be its 2nd wave which is why after an interaction with the 0.786 level I would be expecting another downfall to the downside at around the intersection of the lower confirmed ascending trendline and the 0.382 level.
FXOpen offers the world's most popular cryptocurrency CFDs*, including Bitcoin and Ethereum. Floating spreads, 1:2 leverage — at your service. Open your trading account now or learn more about crypto CFD trading with FXOpen.
*At FXOpen UK and FXOpen AU, Cryptocurrency CFDs are only available for trading by those clients categorised as Professional clients under FCA Rules and Professional clients under ASIC Rules respectively. They are not available for trading by Retail clients.
This article represents the opinion of the Companies operating under the FXOpen brand only. It is not to be construed as an offer, solicitation, or recommendation with respect to products and services provided by the Companies operating under the FXOpen brand, nor is it to be considered financial advice.
Stay ahead of the market!
Subscribe now to our mailing list and receive the latest market news and insights delivered directly to your inbox.

Latest articles

Weekly Market Wrap With Gary Thomson: Nasdaq, EUR/USD, USD/CHF, Brent Crude Oil, Googl Shares
Get the latest scoop on the week's hottest headlines, all in one convenient video. Join Gary Thomson, the COO of FXOpen UK, as he breaks down the most significant news reports and shares his expert insights.
- Nasdaq Composite: Worst Session

Analysis of AUD/USD: Exchange Rate Falls to Early May Low
As indicated by the 4-hour AUD/USD chart today:
→ the rate fell below 0.652, a level last seen on May 2;
→ the RSI indicator dropped below 15, a level last seen during the panic over the spread of COVID-19

Analysis of AMZN Stock: Price at 1.5-Month Low
As shown in the AMZN chart, the stock price dropped below:
→ the psychological level of $180;
→ the mid-June interim low.
The last time AMZN traded below $180 was in early June.
Thus, AMZN has faced sell-offs, similar to other tech