


BTC and XRP - Upward move likely ended
FXOpen

BTC/USD
The price of Bitcoin has been on the rise since the 20th of July when it fell down to $29.316 at its lowest point. From there we have seen an increase of 38.7% as it came up to $40,679 at its highest point yesterday. Today the price fell down to $36,500 area and is now moving to the upside again, but the downfall of 10% might be indicative of the completion of the prior upward movement. 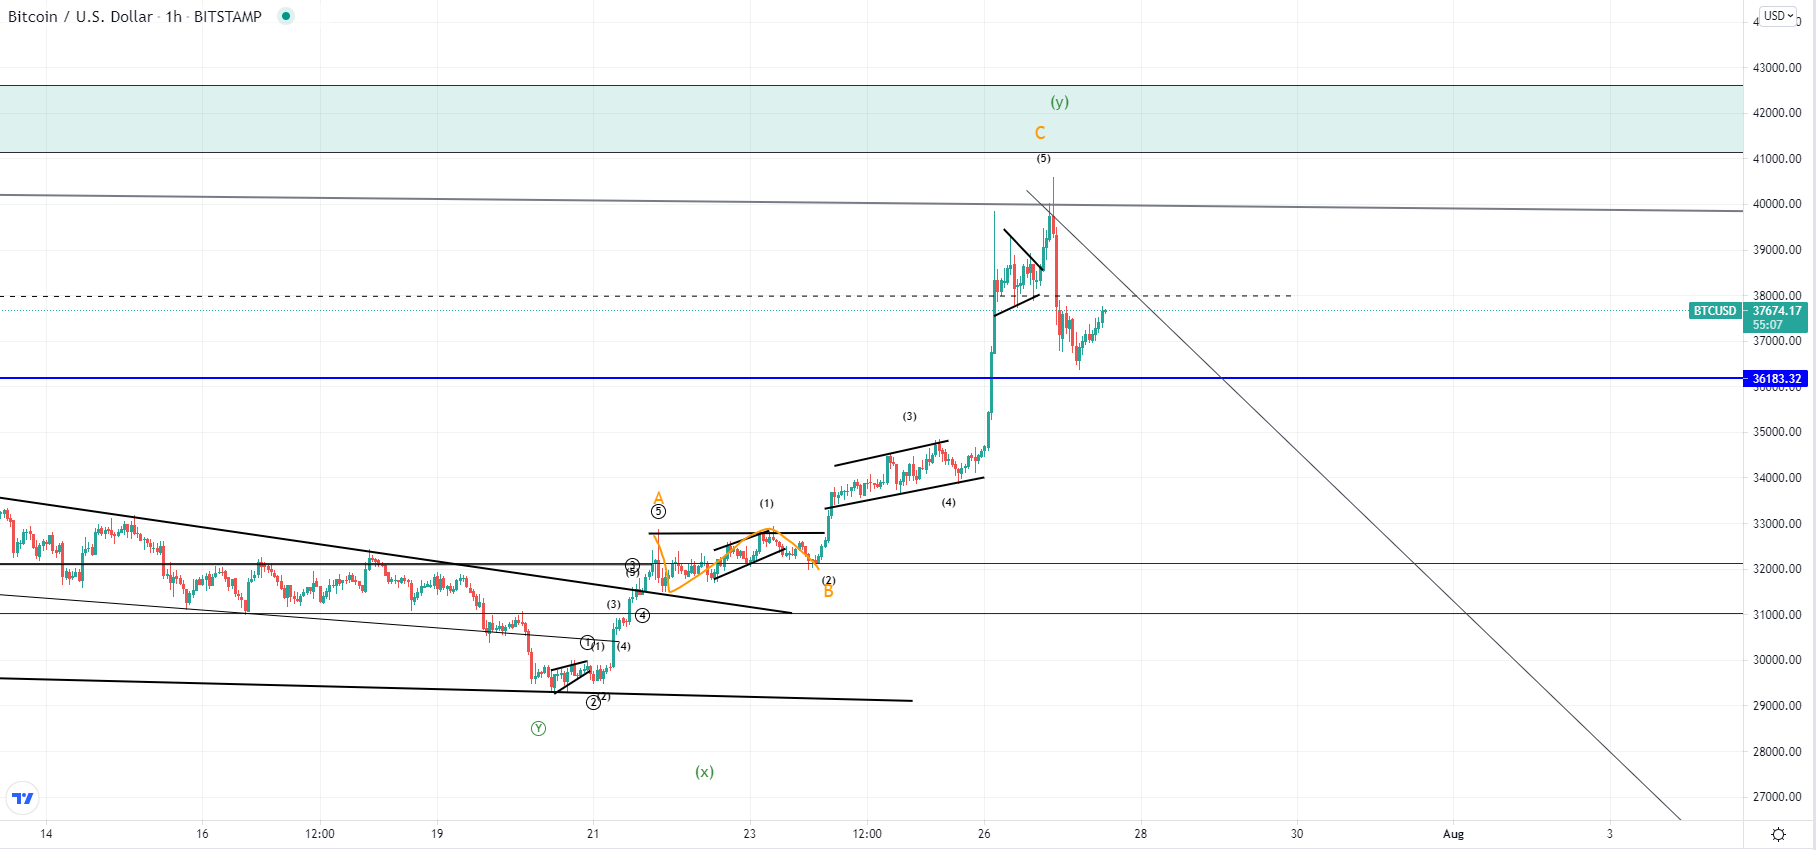
You can see that the price almost reached its most significant resistance zone at around $41,000 but failed to make interaction. The upward move from the 20th of July was impulsive in sections but the wave structure doesn’t imply a five-wave pattern. Instead, we could be looking at an ABC correction to the upside before the next downward move. The upward movement looks completed either way so now at least a retracement would be expected if not a start of a new downtrend.
XRP/USD
The price of Ripple has shown a similar pattern as from the July 20th low of $0.516 we have seen an increase of 31.16% coming to $0.6772 at its highest peak yesterday. After that a decrease was made to around $0.613 and the price is now in a slight recovery. 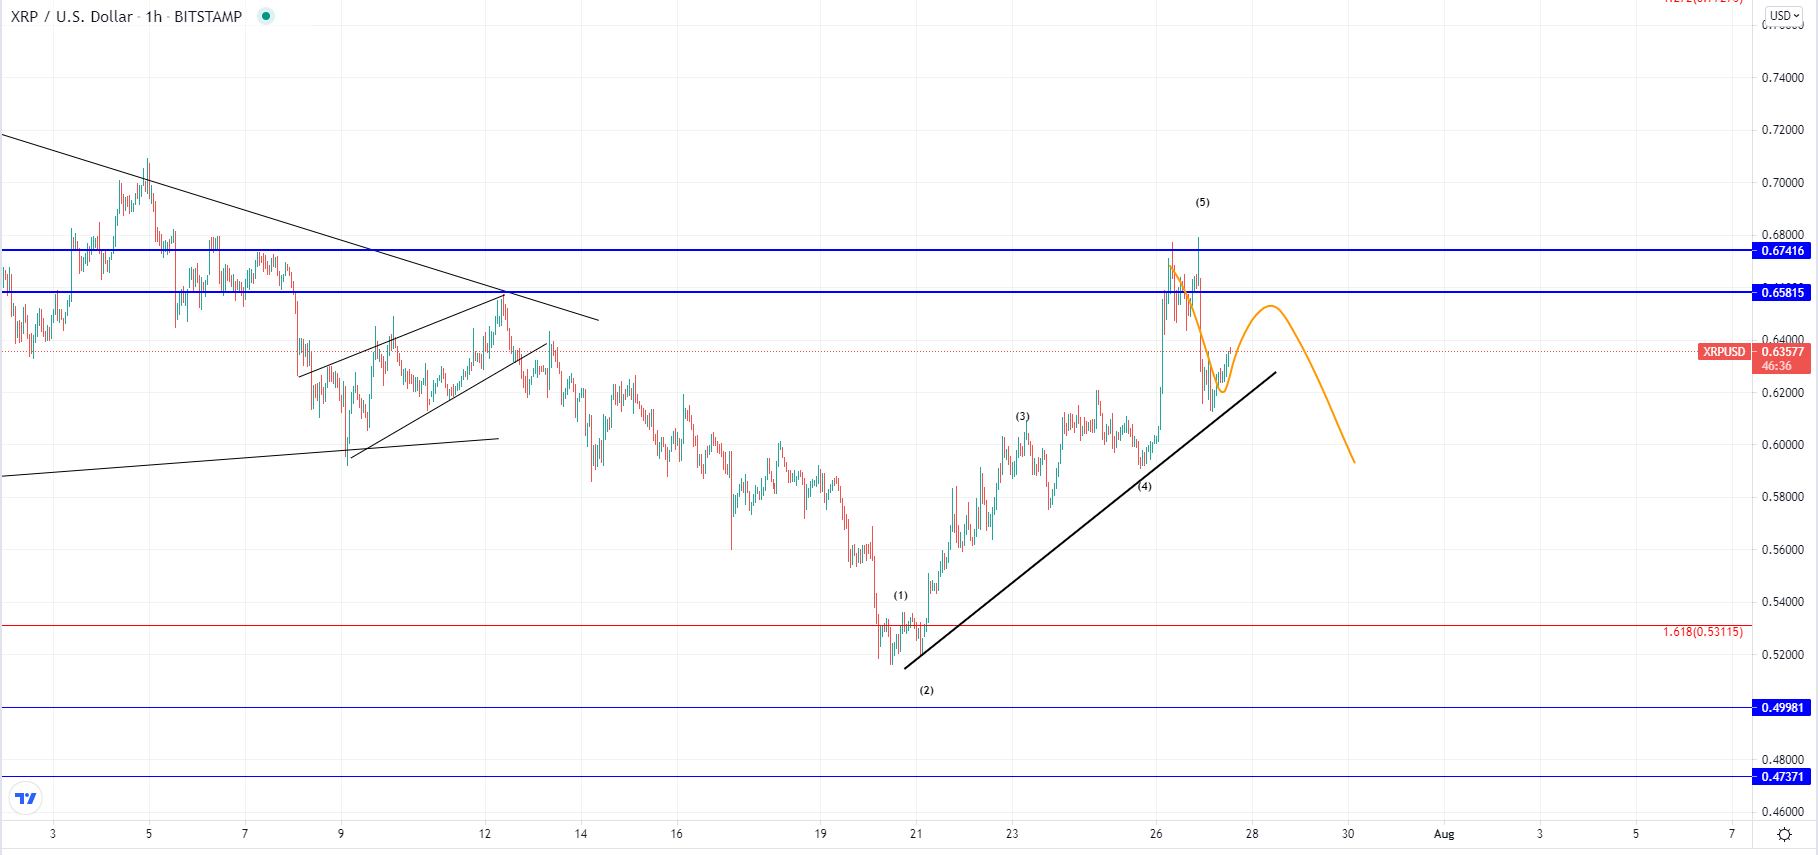 Like in the case of Bitcoin this upward move has most likely ended in a five-wave manner, although the structure isn’t as clear. It reached its significant resistance level and made a sharp decline after the interaction was made. This is why now we are expecting this recovery to be short-lived and another move to the downside from which we are to see if this is a correctional count or the start of another downtrend.
If the prices of both cryptos start increasing again and make a higher high compared to yesterday’s one this descending move scenario would be invalidated, but that isn’t likely at this point.
This forecast represents FXOpen Markets Limited opinion only, it should not be construed as an offer, invitation or recommendation in respect to FXOpen Markets Limited products and services or as financial advice. Cryptocurrency CFDs are not available to trade in all jurisdictions.
This article represents the opinion of the Companies operating under the FXOpen brand only. It is not to be construed as an offer, solicitation, or recommendation with respect to products and services provided by the Companies operating under the FXOpen brand, nor is it to be considered financial advice.
Stay ahead of the market!
Subscribe now to our mailing list and receive the latest market news and insights delivered directly to your inbox.

Latest articles

EUR/USD and GBP/USD consolidate ahead of the Fed decision
European currencies are showing subdued dynamics, entering a consolidation phase following their previous advance. Earlier, EUR/USD and GBP/USD broke out of their ranges and strengthened; however, the subsequent correction has led both pairs to retest the previously breached

Meta: V-Shaped Recovery Meets Heavy Volume Resistance
The movement in Meta Platforms shares is being driven by two competing narratives. On one hand, advertising revenue is benefiting from AI-based tools: the Advantage+ platform continues to support strong advertiser demand, and the analyst consensus for Q1 2026 revenue

Commodity Currencies Test Key Levels Ahead of Major Macro Data
Commodity-linked currencies are trading near key levels, showing restrained price action as market participants adopt a wait-and-see approach. The fundamental backdrop is shaped by expectations surrounding the release of Australia’s inflation data and the Bank of Canada’s interest