FXOpen

BTCUSD: Bullish Engulfing Pattern Above $16372
Bitcoin was unable to sustain its bearish momentum and after touching a low of $16372 on 30th Dec, the prices started to correct upwards against the US dollar and are now ranging above the $16600 handle in the European trading session today.
The price of bitcoin is ranging near the support of the channel in the weekly time frame indicating a bullish trend.
We can clearly see a bullish engulfing pattern above the $16372 handle which is a bullish reversal pattern because it signifies the end of a downtrend and a shift towards an uptrend.
Bitcoin touched an intraday low of 16655 and an intraday high of 16781 in the Asian trading session today.
The price is forming an ascending channel with the current support of $16690 at which the price crosses the 9-day moving average.
Both the STOCH and Williams percent range are indicating overbought levels which means that in the immediate short term, a decline in the prices is expected.
The relative strength index is at 58.47 indicating a STRONG demand for bitcoin, and the continuation of the buying pressure in the markets.
Bitcoin is now moving above its 100 hourly simple moving average and above its 100 hourly exponential moving averages.
Some of the major technical Indicators are giving a BUY signal, which means that in the immediate short term, we are expecting targets of 17500 and 18500.
The average true range is indicating HIGH market volatility with a mild bullish momentum.
- Bitcoin: bullish reversal seen above $16372
- The average directional index is indicating a NEUTRAL level
- The price is now trading just below its pivot level of $16752
- The short term range is mildly bullish
Bitcoin: Bullish Reversal Seen Above $16372

We can now see that the price of bitcoin is moving in the correction phase after the recent decline below the $16500 level. The immediate targets are $17500 and $18500 in the short-term range.
Once the price of bitcoin will touch $18000, we are expecting a rally into the markets towards the $20000 level.
We can see the formation of the bullish trend reversal pattern with the adaptive moving average AMA50 and AMA100 in the 1-hour time frame.
Any dips from the current levels remain well supported above the $16500 handle as the bitcoin price continues to gain traction against the US dollar.
The immediate short-term outlook for bitcoin is mildly bullish, the medium-term outlook has turned neutral, and the long-term outlook remains neutral under present market conditions.
Bitcoin’s support zone is located at $16662 which is a pivot point, and at $16723 which is a 3-10 day MACD oscillator stalls.
The price of BTCUSD is now facing its classic resistance level of 16765 and Fibonacci resistance level of 16773 after which the path towards 17000 will get cleared.
In the last 24hrs, BTCUSD has increased by 0.08% by 13.10$ and has a 24hr trading volume of USD 11.564 billion. We can see an increase of 5.89% in the trading volume compared to yesterday, which appears to be normal.
The Week Ahead
Bitcoin’s price is expected to enter into a consolidation phase below the $17000 level. As the market liquidity increases, we will see the price upticking towards the $18000 handle.
As of now, the moves are expected to be in a narrow range between the $16000 and $17500 levels.
The daily RSI is printing at 47 which indicates a NEUTRAL demand for bitcoin and the possibility of a shift towards the consolidation/correction phase for a short term in the markets.
The price of BTCUSD is now facing its resistance zone at $17096 which is a 38.2% retracement from a 4-week low, and at $17333 which is a 14-3 day raw stochastic at 50%.
The weekly outlook is projected at $17500 with a consolidation zone of $17000.
Technical Indicators:
The MACD (12,26): is at 20.50 indicating a BUY
The commodity channel index, CCI (14): is at 73.18 indicating a BUY
The rate of price change, ROC: is at 0.048 indicating a BUYBull/bear power (13): is at 31.92 indicating a BUY
XRPUSD: Hammer Pattern Above 0.2987
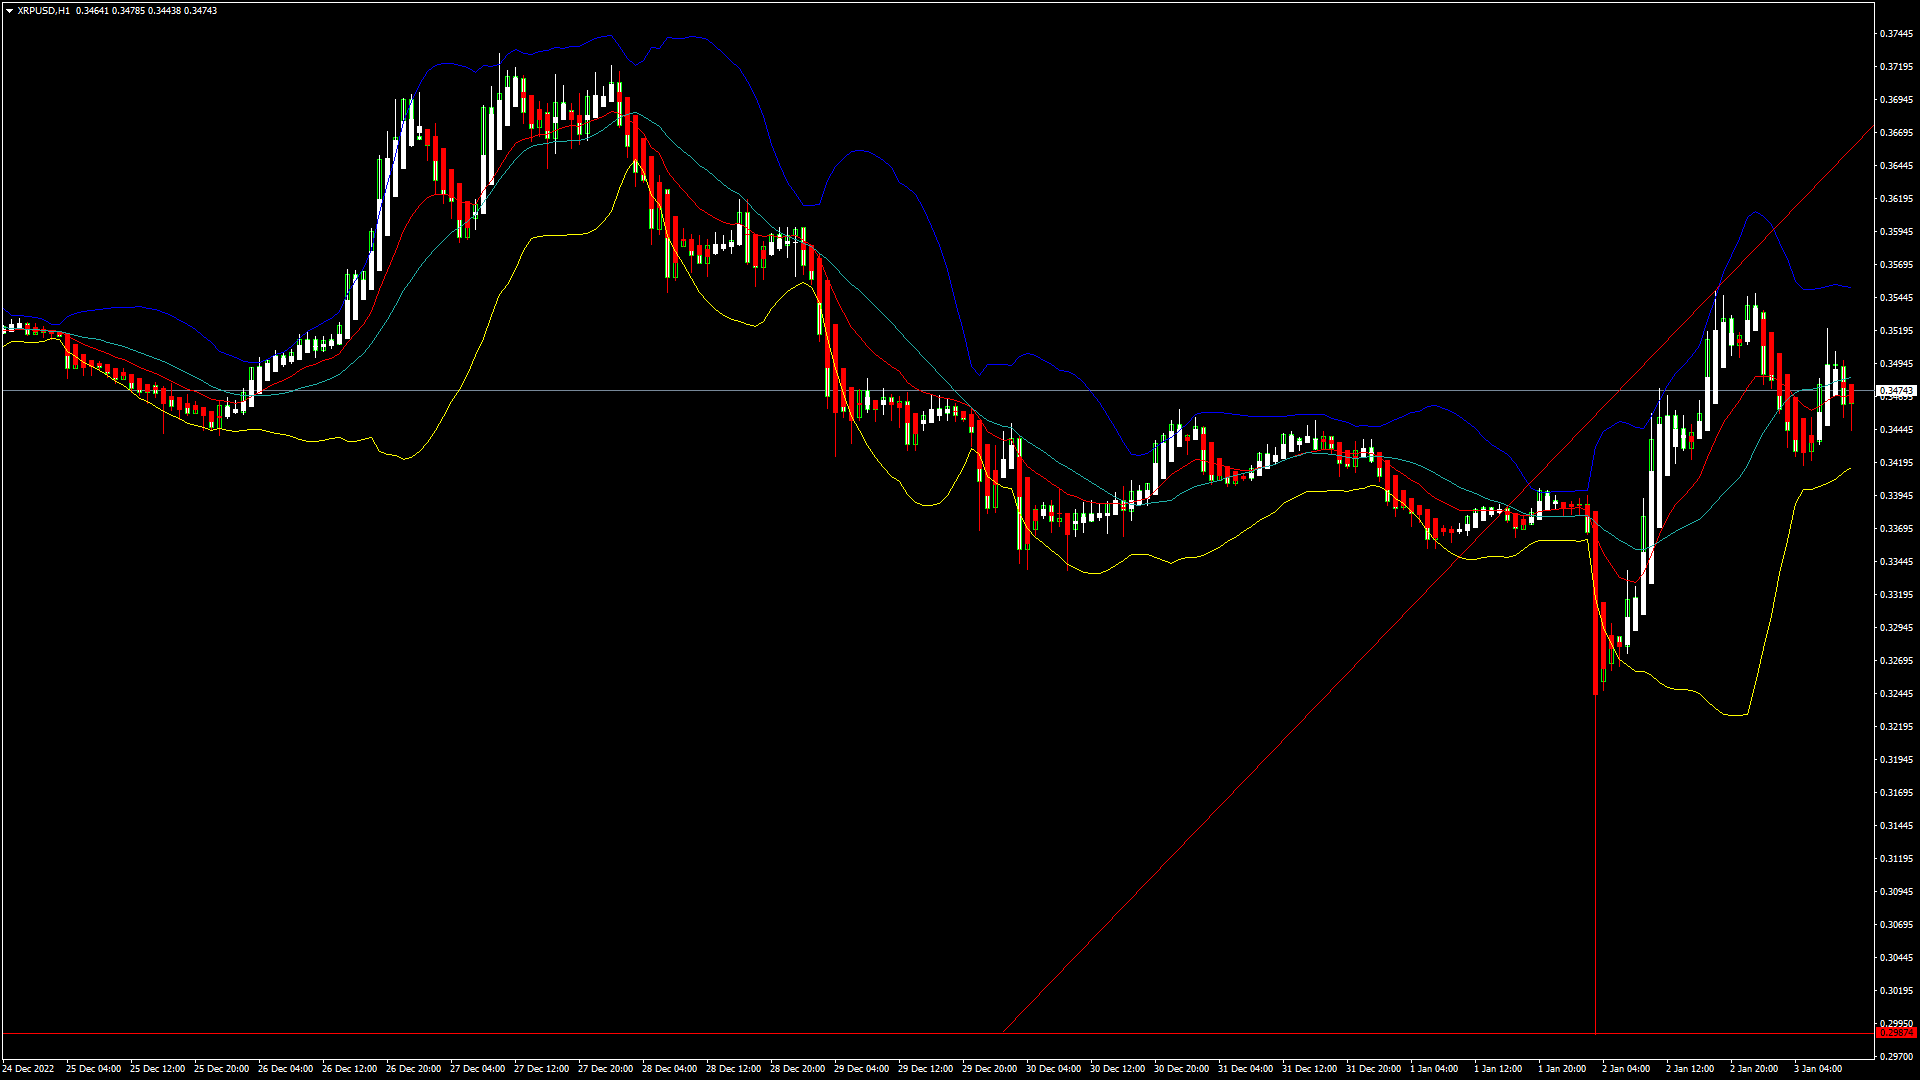
Ripple was unable to sustain its bearish momentum and after touching a Low of 0.2987 on 02nd Jan, the price started to correct upwards against the US dollar crossing the $0.3400 handle today in the European trading session.
The price of Ripple is ranging near the support of the triangle in the daily time frame indicating a bullish trend.
We can clearly see a hammer pattern above the 0.2987 handle which is a bullish reversal pattern because it signifies the end of a downtrend and a shift towards an uptrend.
Ripple touched an intraday high of 0.3540 and an intraday low of 0.3418 in the Asian trading session today.
The relative strength index is at 54.12 which signifies a NEUTRAL demand for Ripple at the current market prices and the shift towards the consolidation phase in the markets.
Some of the moving averages are giving a BUY signal at the current market level of 0.3474.
Both the STOCH and commodity channel index, CCI, are indicating a NEUTRAL level.
Ripple is now trading above its pivot level of 0.3471 and facing its classic resistance level of 0.3489 and Fibonacci resistance level of 0.3515 after which the path towards 0.3600 will get cleared.
Some of the major technical indicators are giving a BUY signal.
- Ripple: bullish reversal seen above the 0.2987 level
- The STOCHRSI is indicating an OVERBOUGHT level
- The average true range indicates LESS volatility
- Ripple gains bullish bias against the US dollar
Ripple: Bullish Reversal Seen Above 0.2987

We can see that the price of Ripple has started to resume the upwards trend after the recent decline below the $0.3000 handle. We are now looking for fresh upsides in the range of $0.3500 and $0.4000 levels.
We can see the formation of a bullish price crossover pattern with moving average MA20 in the 30-minute time frame.
We can see the bullish trend reversal pattern with the adaptive moving average AMA20 in the 1-hourly time frame.
The short-term outlook for Ripple has turned mildly bullish, the medium-term outlook is neutral, and the long-term outlook is neutral under present market conditions.
The price of XRPUSD has increased by 0.79% with a price change of $0.002717 in the past 24hrs and has a trading volume of 0.939 billion USD.
We can see a decrease of 1.14% in the trading volumes of Ripple compared to yesterday, which appears to be normal.
This Week Ahead
The price of Ripple is preparing for its next leg of upwards movement against the US dollar and bitcoin. There is a major bullish trend line formation with a support located at $0.3402 which is 14-3 day raw stochastic at 30%
We can see a continuous progression of a bullish trend line formation from $0.2987 towards the $0.3681 level.
The resistance zone is located at $0.3559 which is a 14-3 day raw stochastic at 50% and at $0.3576 which is a 3-10 day MACD oscillator stalls.
The weekly outlook for Ripple is projected at $0.3700 with a consolidation zone of $0.3650.
Technical Indicators:
The MACD (12,26): is at 0.001 indicating a BUY
The ultimate oscillator: is at 54.97 indicating a BUY
The ADX (14): is at 25.57 indicating a BUY
High/lows (14): is at 0.000 indicating a NEUTRAL
FXOpen offers the world's most popular cryptocurrency CFDs*, including Bitcoin and Ethereum. Floating spreads, 1:2 leverage — at your service. Open your trading account now or learn more about crypto CFD trading with FXOpen.
*At FXOpen UK and FXOpen AU, Cryptocurrency CFDs are only available for trading by those clients categorised as Professional clients under FCA Rules and Professional clients under ASIC Rules respectively. They are not available for trading by Retail clients.
This article represents the opinion of the Companies operating under the FXOpen brand only. It is not to be construed as an offer, solicitation, or recommendation with respect to products and services provided by the Companies operating under the FXOpen brand, nor is it to be considered financial advice.
Stay ahead of the market!
Subscribe now to our mailing list and receive the latest market news and insights delivered directly to your inbox.


