


FXOpen
BTC/USD
The price of Bitcoin has been increasing since last week and has come up from $7550 at its lowest point on Thursday, to $8892 at its highest point made yesterday which is an increase of around 18%.
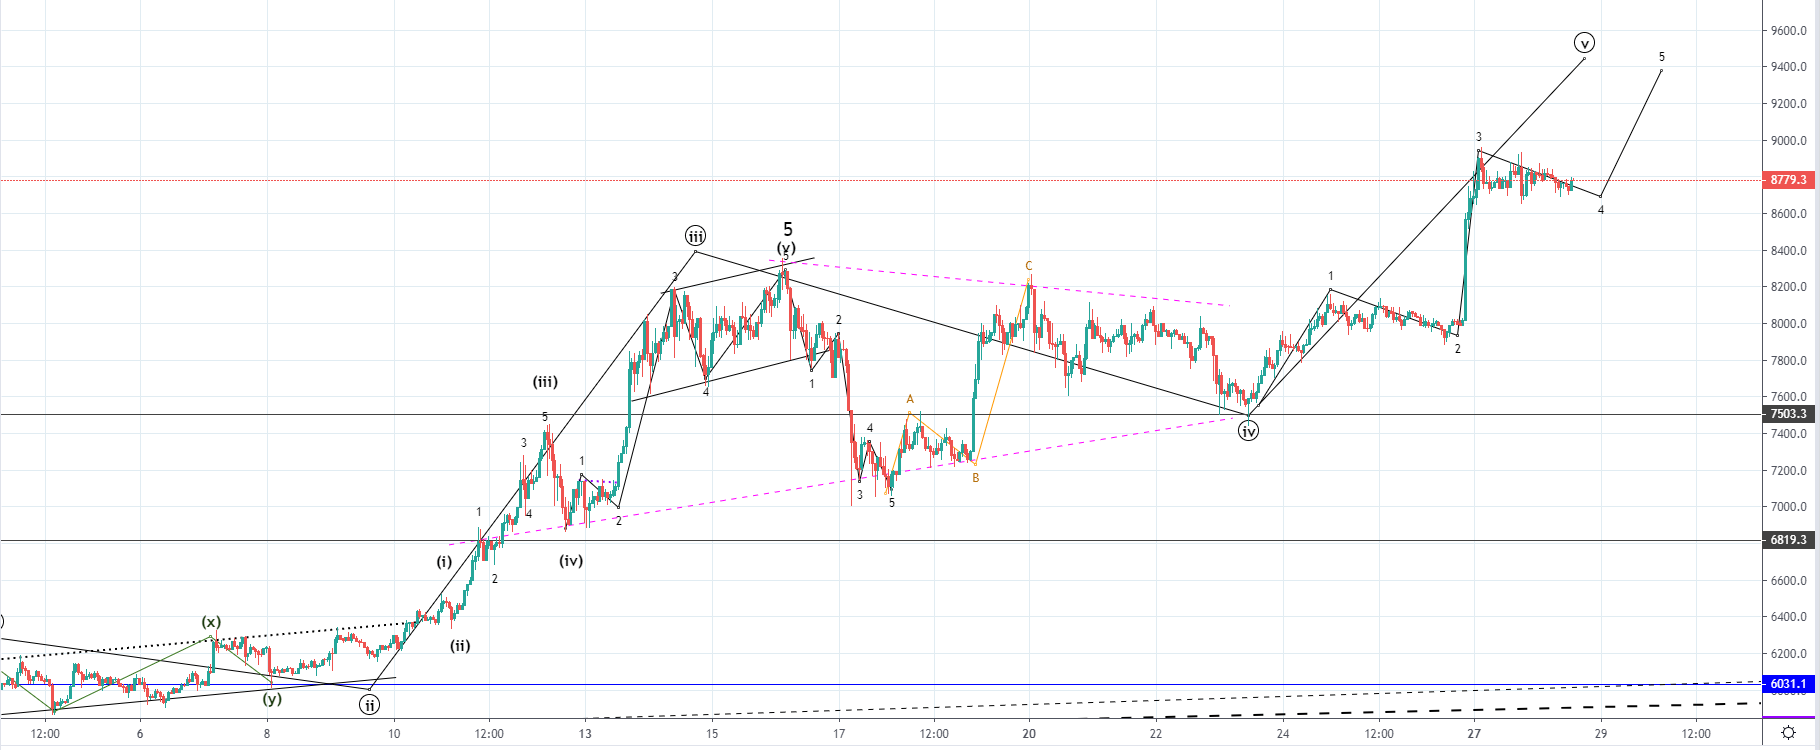
Looking at the hourly chart, you can see that the price of Bitcoin was still inside the territory of the symmetrical triangle made by the corrective 4th wave, last week. As the correction developed fully, establishing support again on the triangles support level another and the final wave has started to develop. This final ending wave of the Minute count and with the 5th wave from the higher degree Minor count. As it hasn’t developed fully another increase would be expected but only as a minor once, potentially reaching $9400 before its completion.
But after the completion of the five-wave move, I would be expecting a higher degree downtrend to start which could be the start of the downtrend which is set to bring the price of Bitcoin significantly lower, to some of the broken resistance levels which were broken on the way up, out of which the most significant one is at around $6250-6500. A retracement back to the broken resitance for a retest of support could be seen as a test of support. If the price falls to hold above this key support, further downfall could be seen to the next significant support zone which is at around $4300 level.
XRP/USD
From last Thursday when the price of Ripple was $0.36133 at its lowest point last week, measured to the highest, made yesterday at $0.43791, we have seen an increase of 21.19%.
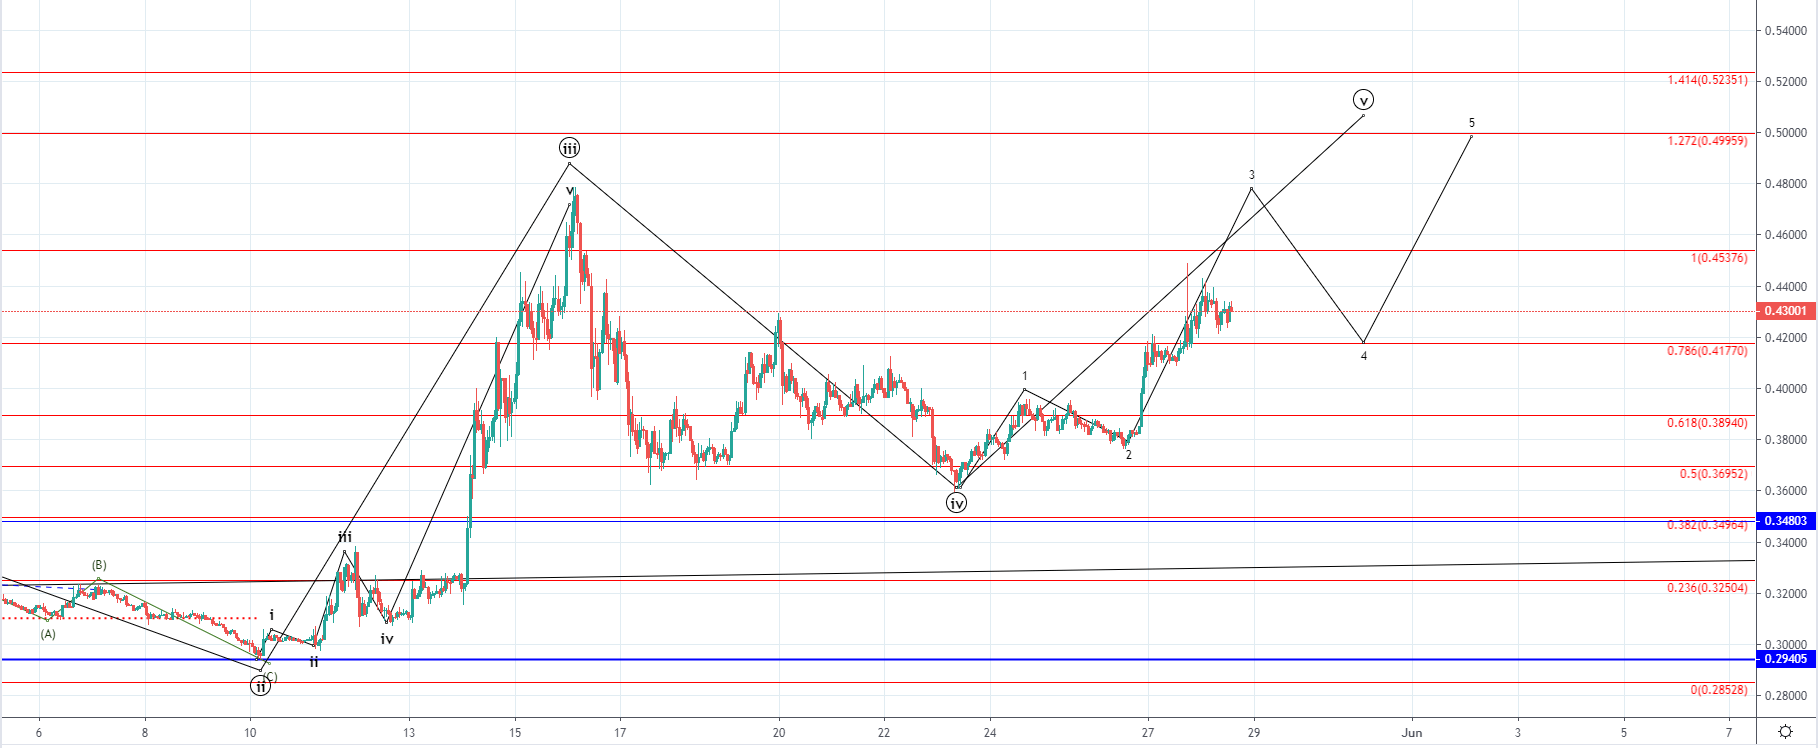
This increase is the 5th wave from the Minute count and is the continuation of the bullish momentum after the 4th correctional wave pushed the price of Ripple down by 24% from the previous high which was the ending point of the 3rd wave. Now that another impulsive move has started I would be expecting to see the price exceeding the 3rd wave whose ending point was around $0.4785.
As this would be the 5th wave from the higher degree count, when it ends I would be expecting a downtrend of a higher degree to start which would set to bring the price of Ripple down to some of the significant support levels for an establishment of support. Before that, the price would likely continue moving to the upside but since we’ve seen three waves out of the last five-wave move developing, the increase expected would only be a minor one, and would likely reach the next Fibo level at 1.272 which is in price terms just below $0.5.
FXOpen offers the world's most popular cryptocurrency CFDs*, including Bitcoin and Ethereum. Floating spreads, 1:2 leverage — at your service. Open your trading account now or learn more about crypto CFD trading with FXOpen.
*At FXOpen UK and FXOpen AU, Cryptocurrency CFDs are only available for trading by those clients categorised as Professional clients under FCA Rules and Professional clients under ASIC Rules respectively. They are not available for trading by Retail clients.
This article represents the opinion of the Companies operating under the FXOpen brand only. It is not to be construed as an offer, solicitation, or recommendation with respect to products and services provided by the Companies operating under the FXOpen brand, nor is it to be considered financial advice.
Stay ahead of the market!
Subscribe now to our mailing list and receive the latest market news and insights delivered directly to your inbox.

Latest articles

Weekly Market Wrap With Gary Thomson: Nasdaq, EUR/USD, USD/CHF, Brent Crude Oil, Googl Shares
Get the latest scoop on the week's hottest headlines, all in one convenient video. Join Gary Thomson, the COO of FXOpen UK, as he breaks down the most significant news reports and shares his expert insights.
- Nasdaq Composite: Worst Session

Analysis of AUD/USD: Exchange Rate Falls to Early May Low
As indicated by the 4-hour AUD/USD chart today:
→ the rate fell below 0.652, a level last seen on May 2;
→ the RSI indicator dropped below 15, a level last seen during the panic over the spread of COVID-19

Analysis of AMZN Stock: Price at 1.5-Month Low
As shown in the AMZN chart, the stock price dropped below:
→ the psychological level of $180;
→ the mid-June interim low.
The last time AMZN traded below $180 was in early June.
Thus, AMZN has faced sell-offs, similar to other tech