


BTC/USD and XRP/USD - bullish movement is corrective, more downside expected
FXOpen
BTC/USD
From last week’s analysis, when the price of Bitcoin was $3925, we have seen stagnation as the price was hovering sideways around those level until yesterday, when another decrease of 3.12% was made from $3906 to $3784.
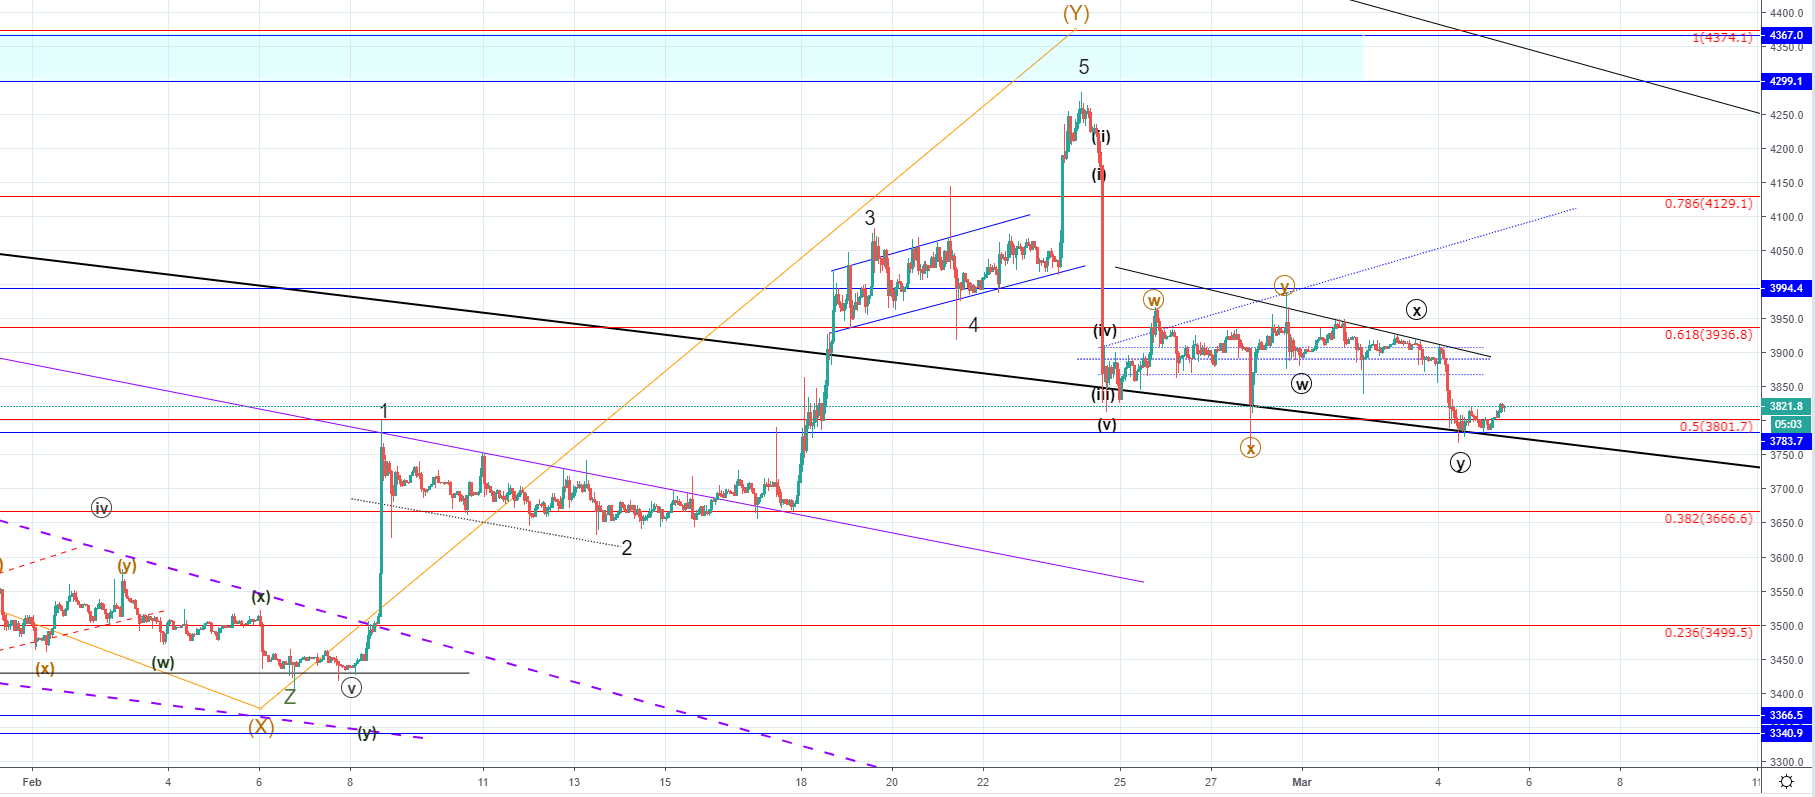
Looking at the hourly chart, we can see that yesterday’s decrease was a breakout from the horizontal range in which the price moved sideways, consolidating after the initial drop of over 10%. The price fell to the most significant support level which is the baseline support since the start of the bear market and has found support there as it retested the level twice before going in an upward trajectory again.
Now, when the price is above the 0.5 Fibonacci level and the baseline support, we are most likely to see further upside movement, but according to my count, it would be the final Minute correction to the upside before the price starts moving down again for a breakout to the downside. This is expected due to the fact that previous to the formation of the horizontal range we have seen an impulsive move to the downside, which is most likely to continue after the period of consolidation ends as the Intermediate Y wave ended and we are most likely seeing an impulsive move to the downside as a trend continuation.
XRP/USD
The price of Ripple has decreased by 4.84% over the course of the last seven days as it came down from $0.33561 on Tuesday to the current level at $0.31885.
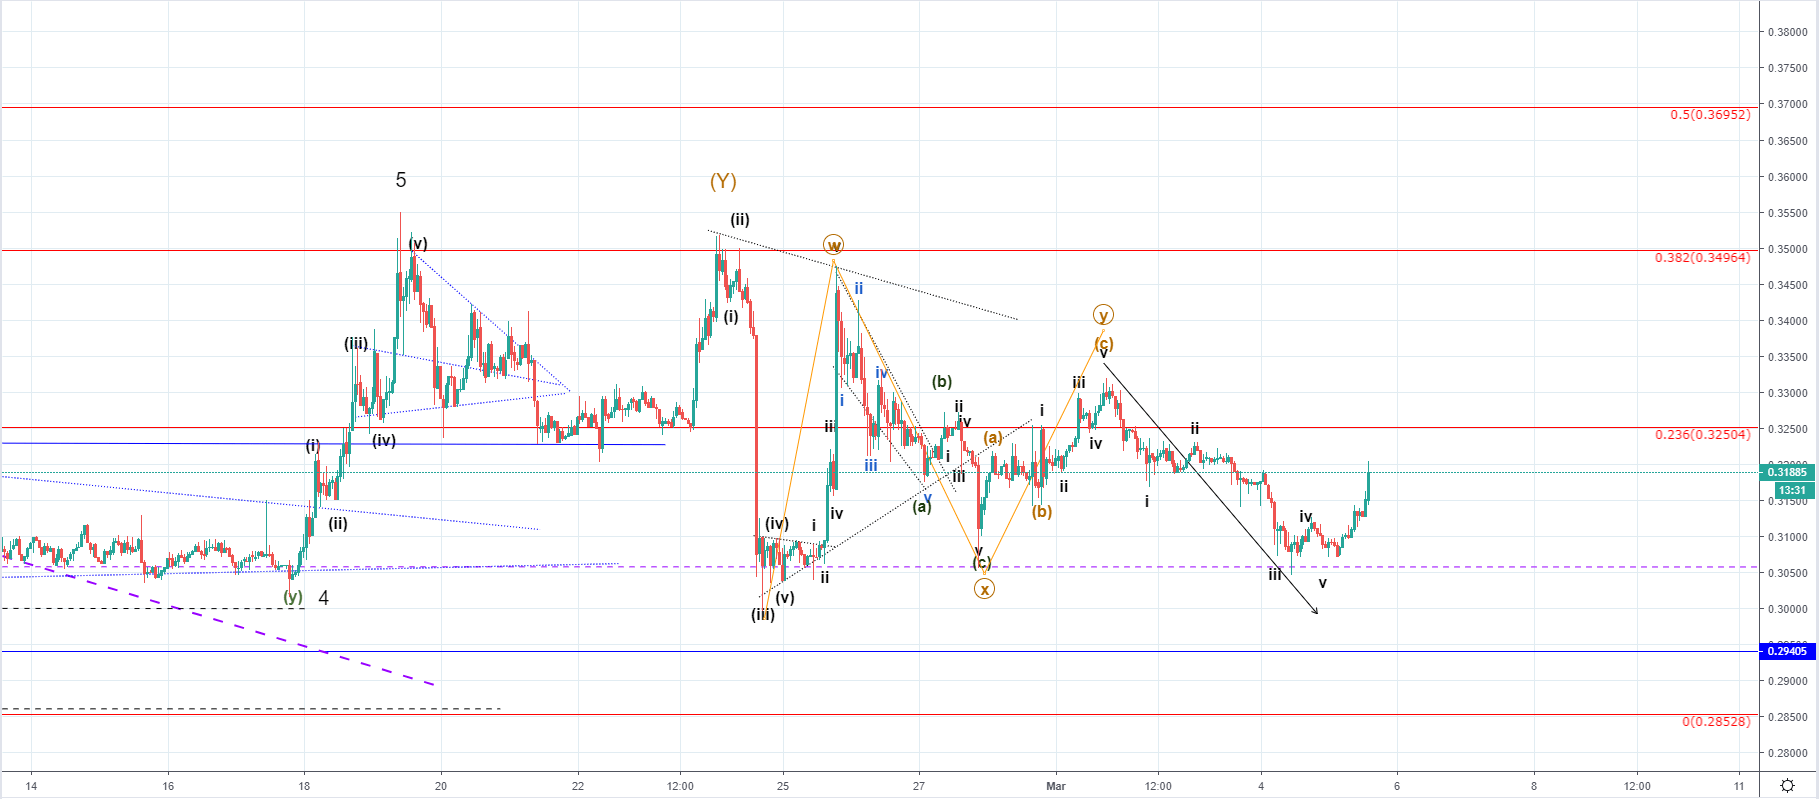
On the hourly chart, we can see that the price of Ripple is once again in an upward trajectory as it came down to its horizontal support on a 5-wave move. Like in the case of Bitcoin I believe that this upside movement is correctional as previously the price of Ripple broke below the 0.236 Fibonacci level, which served as support, and we could see now the price back to its vicinity for a retest of resistance.
Wave structure implies that the current increase is impulsive, so the previous 5-wave move wasn’t the beginning of the next impulse wave to the downside and is most likely the correction inside the Minute WXY and the current increase could be the Y wave as the previous movement to the downside could be the wave X. If this is true, then we could see the price of Ripple go above the 0.236 Fibonacci level before further downside, although now very likely.
FXOpen offers the world's most popular cryptocurrency CFDs*, including Bitcoin and Ethereum. Floating spreads, 1:2 leverage — at your service (additional fees may apply). Open your trading account now or learn more about crypto CFD trading with FXOpen.
*Important: At FXOpen UK, Cryptocurrency trading via CFDs is only available to our Professional clients. They are not available for trading by Retail clients. To find out more information about how this may affect you, please get in touch with our team.
This article represents the opinion of the Companies operating under the FXOpen brand only. It is not to be construed as an offer, solicitation, or recommendation with respect to products and services provided by the Companies operating under the FXOpen brand, nor is it to be considered financial advice.
Stay ahead of the market!
Subscribe now to our mailing list and receive the latest market news and insights delivered directly to your inbox.


Latest articles

Pound at Key Levels: Markets Assess Impact of Political Uncertainty in the UK
The British pound remains under pressure following increased political uncertainty in the United Kingdom triggered by the Prime Minister’s resignation. Investors are assessing potential shifts in the political and economic policy outlook after the head of government stepped down,

Silver: Fed Tightens Its Tone as Price Returns to the Volume Profile Zone
Silver came under pressure following the Federal Reserve’s June meeting, at which policymakers kept interest rates unchanged at 3.50–3.75%. Nine of the 18 committee members still see the possibility of a rate increase this year, reinforcing

Ethereum: Market Assesses the Strength of the Corrective Recovery
Following a period of heightened volatility in early June, investor attention in Ethereum has once again shifted towards institutional demand and the development of the spot ETF market in the United States. The funds launched last year continue to serve