


BTC/USD and XRP/USD Fake-out
FXOpen
BTC/USD
Yesterday the price of Bitcoin has fallen to $9040 and even spiked a bit further to the downside below the $9k mark making a lower low compared to Friday’s one and has attempted to break out the ascending channels support level but spiked back up inside its territory reaching $9573 at its highest point today.
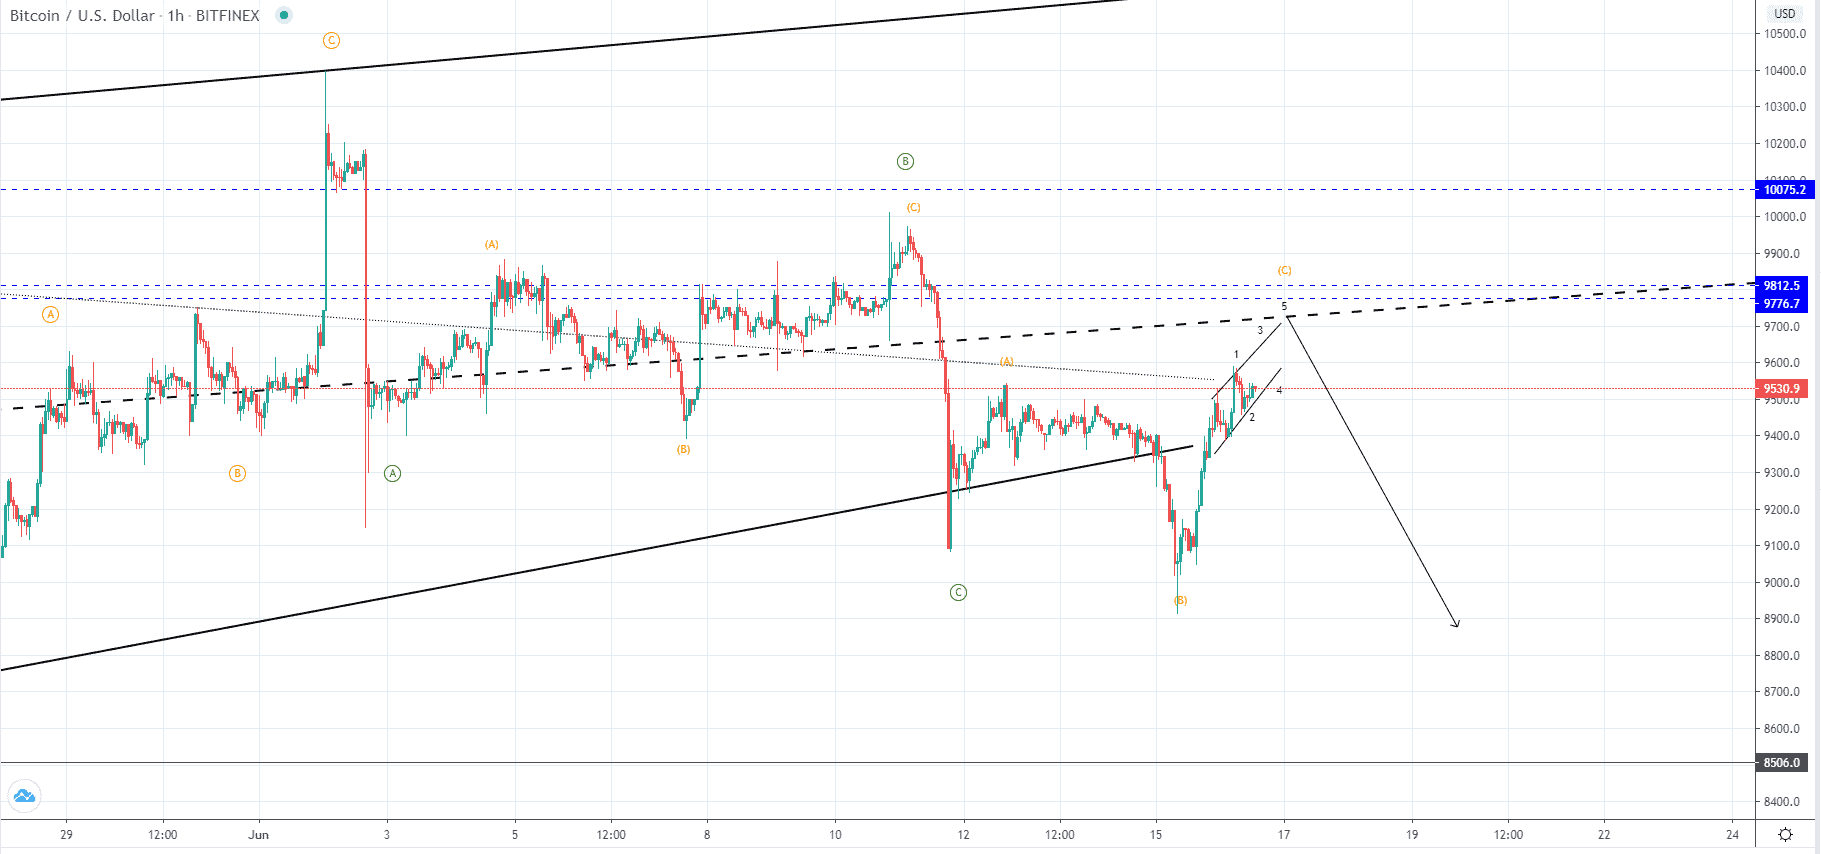 Looking at the hourly chart we can see that the price spiked back to the minor descending level and found resistance there which is the upper level of the made symmetrical triangle from the 8th of May. This is why we are currently seeing a cluster being formed with a clear indication of what the upward pressure is to assume, especially considering that another lower degree ascending channels is being formed.
Interaction with the midpoint ascending interrupted trendline could be expected before the end of this increase inside the ascending channel for a retest of resistance, but if this increase was corrective in nature and was another upward ABC correction we are to see a proper breakout after it’s completion leading for another lower low. If this was a C wave of lower degree count then another three-wave corrective movement could be expected to the downside potential to the $8500 area which would lead this correction as a higher degree WXYXZ count which is what I would be expecting.
But another possibility would be that we have seen the completion of the three-wave higher degree correction (WXY) on yesterday’s low in which case the spiky upside move would be the start of the next impulse five-wave move to the upside. As significant resistance level is soon to be interacted with, from the depth and the momentum of the expected downside move we are to evaluate these possibilities.
XRP/USD
The price of Ripple has increased by 6.29% since yesterday’s low at $0.1823 as it came up to $0.19384 at its highest point today. Currently, it is being traded slightly lower but is still in an upward trajectory slightly moving sideways.
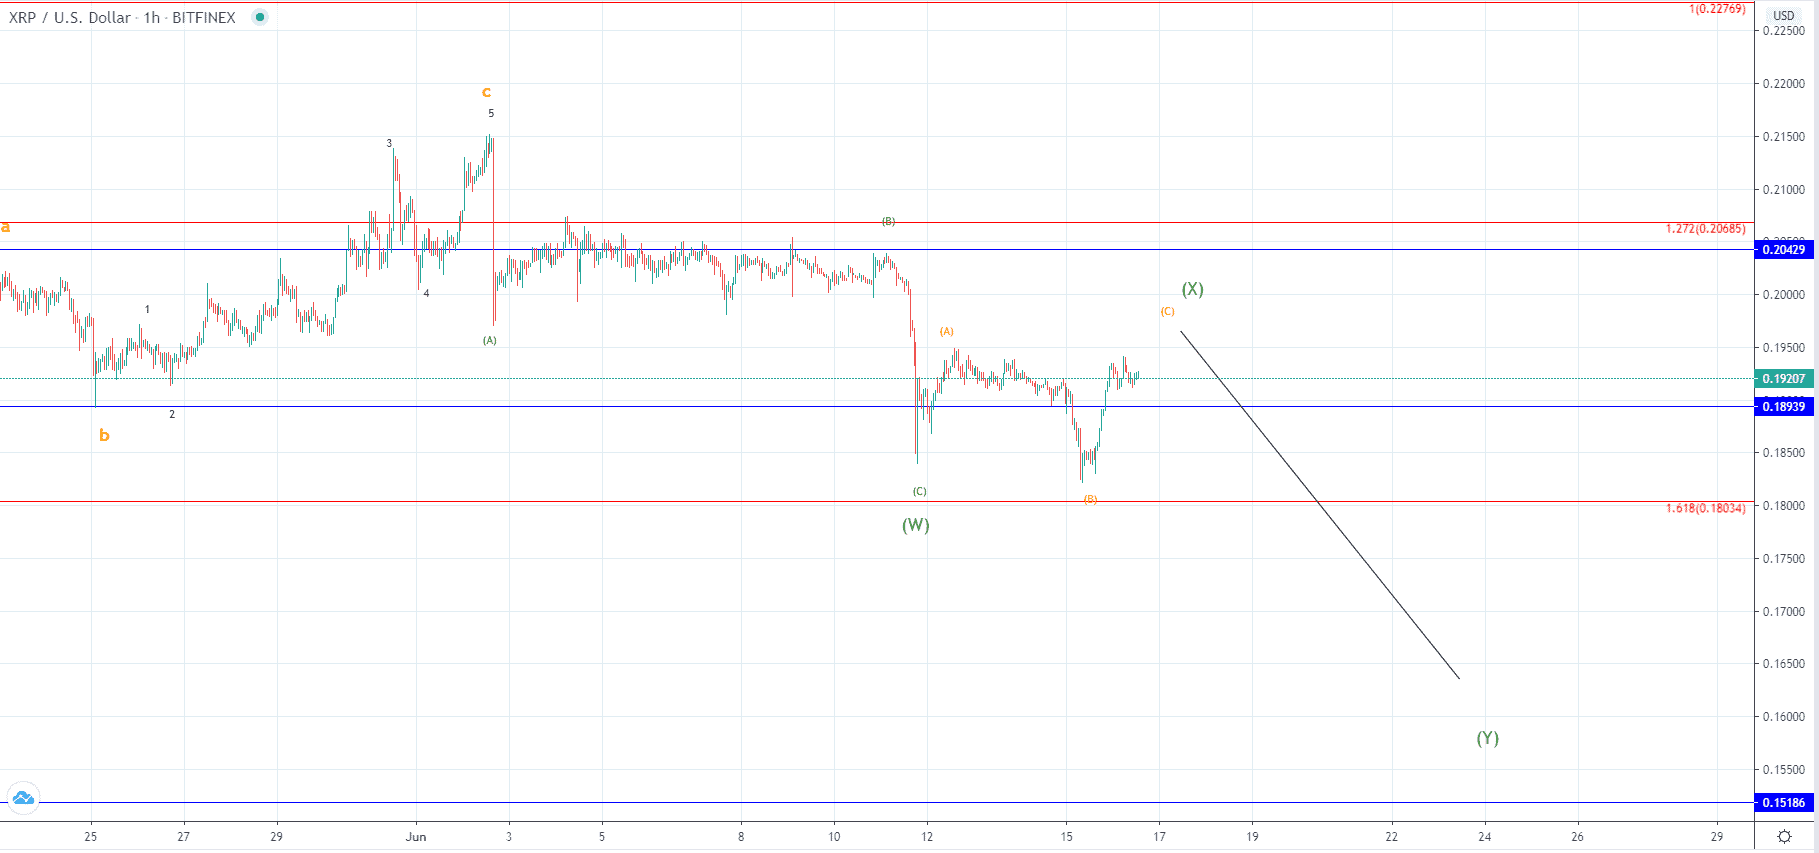 On the hourly chart, you can see that a breakout below the significant horizontal level at $0.18939 was made but the price got back up above it again around the levels from which the descending move was made. Like in the case of Bitcoin this movement from the 12th of June looks like another ABC correction to the upside which is why after another minor ascending move I would be expecting a proper breakout leading the price of Ripple significantly lower.
As on the 2nd of June, we have seen the start of the impulsive move to the downside which led the price into a 14.23% depreciation the one we are seeing now is most likely a retest of the $0.19 area support now serving as resistance before the downtrend continues.
FXOpen offers the world's most popular cryptocurrency CFDs*, including Bitcoin and Ethereum. Floating spreads, 1:2 leverage — at your service (additional fees may apply). Open your trading account now or learn more about crypto CFD trading with FXOpen.
*Important: At FXOpen UK, Cryptocurrency trading via CFDs is only available to our Professional clients. They are not available for trading by Retail clients. To find out more information about how this may affect you, please get in touch with our team.
This article represents the opinion of the Companies operating under the FXOpen brand only. It is not to be construed as an offer, solicitation, or recommendation with respect to products and services provided by the Companies operating under the FXOpen brand, nor is it to be considered financial advice.
Stay ahead of the market!
Subscribe now to our mailing list and receive the latest market news and insights delivered directly to your inbox.


Latest articles

EUR/USD Eyes Gains As USD/CHF Weakness Deepens Again
EUR/USD started a fresh increase above 1.1700 and 1.1720. USD/CHF declined further and is now struggling below 0.7835.
Important Takeaways for EUR/USD and USD/CHF Analysis Today
· The Euro started a decent increase from

Apple: Earnings Day Above the Activity Zone
On 30 April, after the market close, Apple Inc. will release its financial results for the second quarter of fiscal 2026. The consensus forecast, based on estimates from 31 analysts, points to revenue of around $109.7 billion, with expected

USD/JPY and USD/CHF Near Key Levels: The Dollar Supported by the Fed
The US dollar continues to trend upwards following the Federal Reserve meeting, drawing support from the regulator’s moderately hawkish stance and comments by Jerome Powell. Markets interpret the Fed’s rhetoric as a signal that restrictive policy is likely