


BTC/USD and XRP/USD - further downside expected
FXOpen

BTC/USD
Last week the price of Bitcoin started failing impulsively after reaching $13714 at its highest point on Wednesday. The price decreased by over 24% on the next day as it came down to $10400 at its lowest spiked by the hourly candle closed above $10772 after which recovery took place. From Friday’s open at $10817 we have seen a recovery of 14.12% on Saturday as the price came up slightly below the 0.618 Fibonacci level which is in price terms at $12342.
On the next day, another attempt has been made for the price to surpass the 0.618 Fib level but the price action formed a lower high which was an early sign of weakness with the price immediately starting to move impulsively to the downside again as the third wave out of the starting downtrend has begun.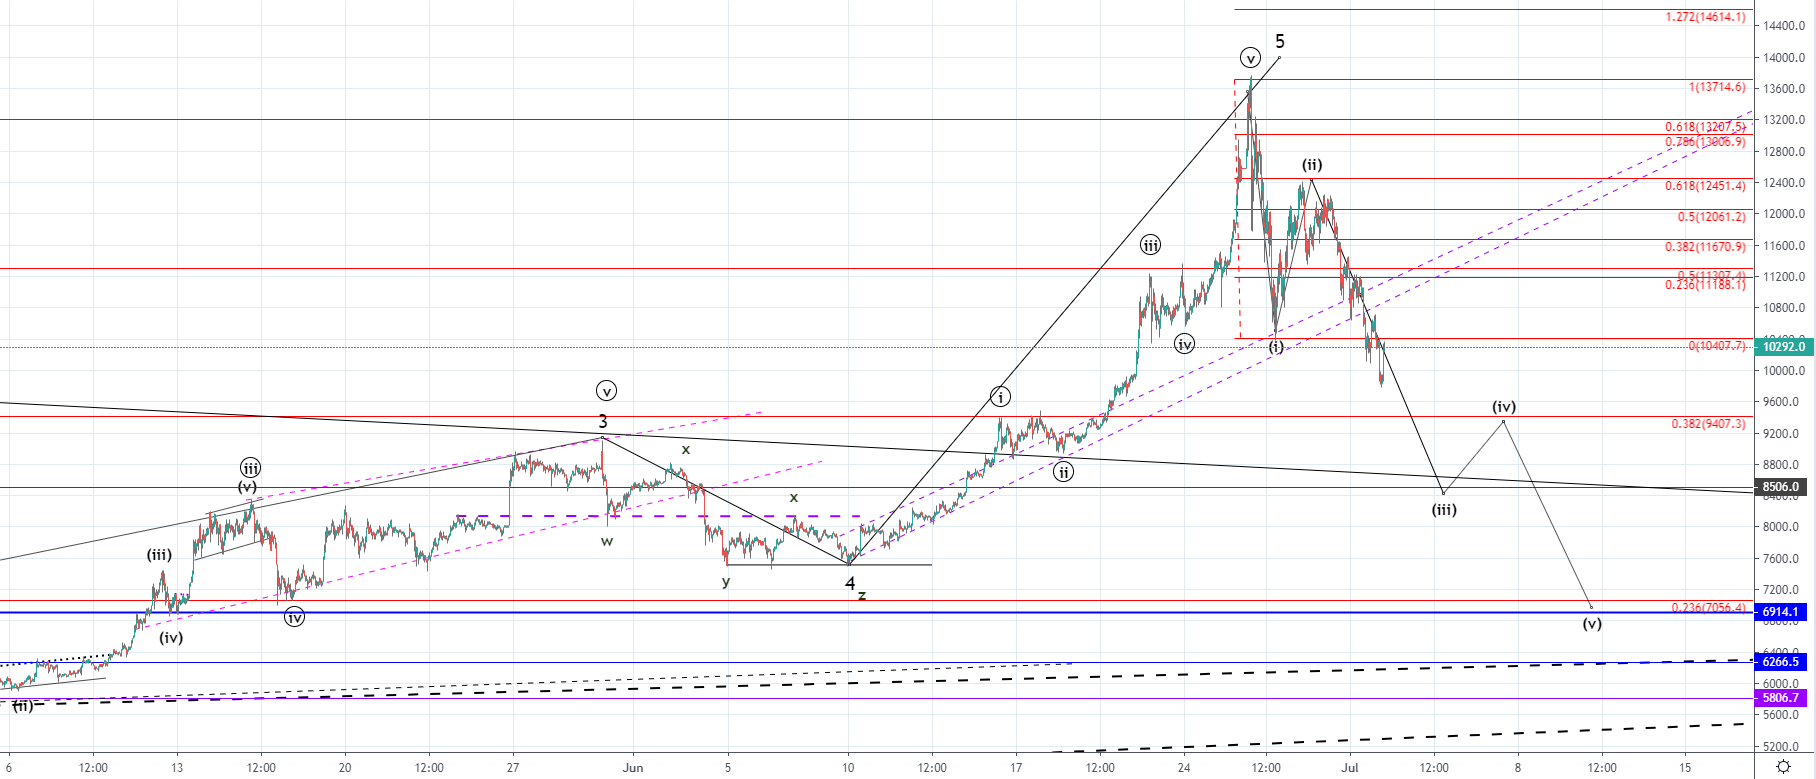 As you can see from the hourly chart, the price of Bitcoin fell to the starting point of the weekend’s recovery and was found support around the ascending channel made from 10th of June but as the sellers have been applying pressure the support broke with the price now being below it as it fell to $9774 on its lowest point. Currently, the price is being traded at $10292 as it has been testing the 0 Fib level for resistance.
With the price retesting the broken support for resistance and has made a downfall of 20.36% from Saturday’s high till today’s low are most likely seeing some correctional movement before further downtrend continuation as we are seeing the development of the third wave after the five-wave impulse wave to the upside ended last Wednesday. This third wave could be the one out of the five-wave move to the downside which could be the first sub-wave of the higher degree correction.
Another possibility would be that impulsive decrease would end on the third wave as it could be an ABC correction as a sub-wave of a more complex correctional structure but in either way, I would be expecting further downside for the price of Bitcoin to some of the broken resistance points on the way up out of which the first significant one would be at around $8500 area.
XRP/USD
The price of Ripple has decreased by 20.24% from last Wednesday’s high at $0.48858 to the 0.618 Fibonacci level which was the lowest point today as the price came down to $0.3894. The price fell around the vicinity of the 0.618 Fibonacci level on last Friday after which recovery of over 9% has been seen with the price reaching $0.42812 at its highest point over the weekend, but since it entered the seller’s territory above 0.786 Fib level another sell-off has started.
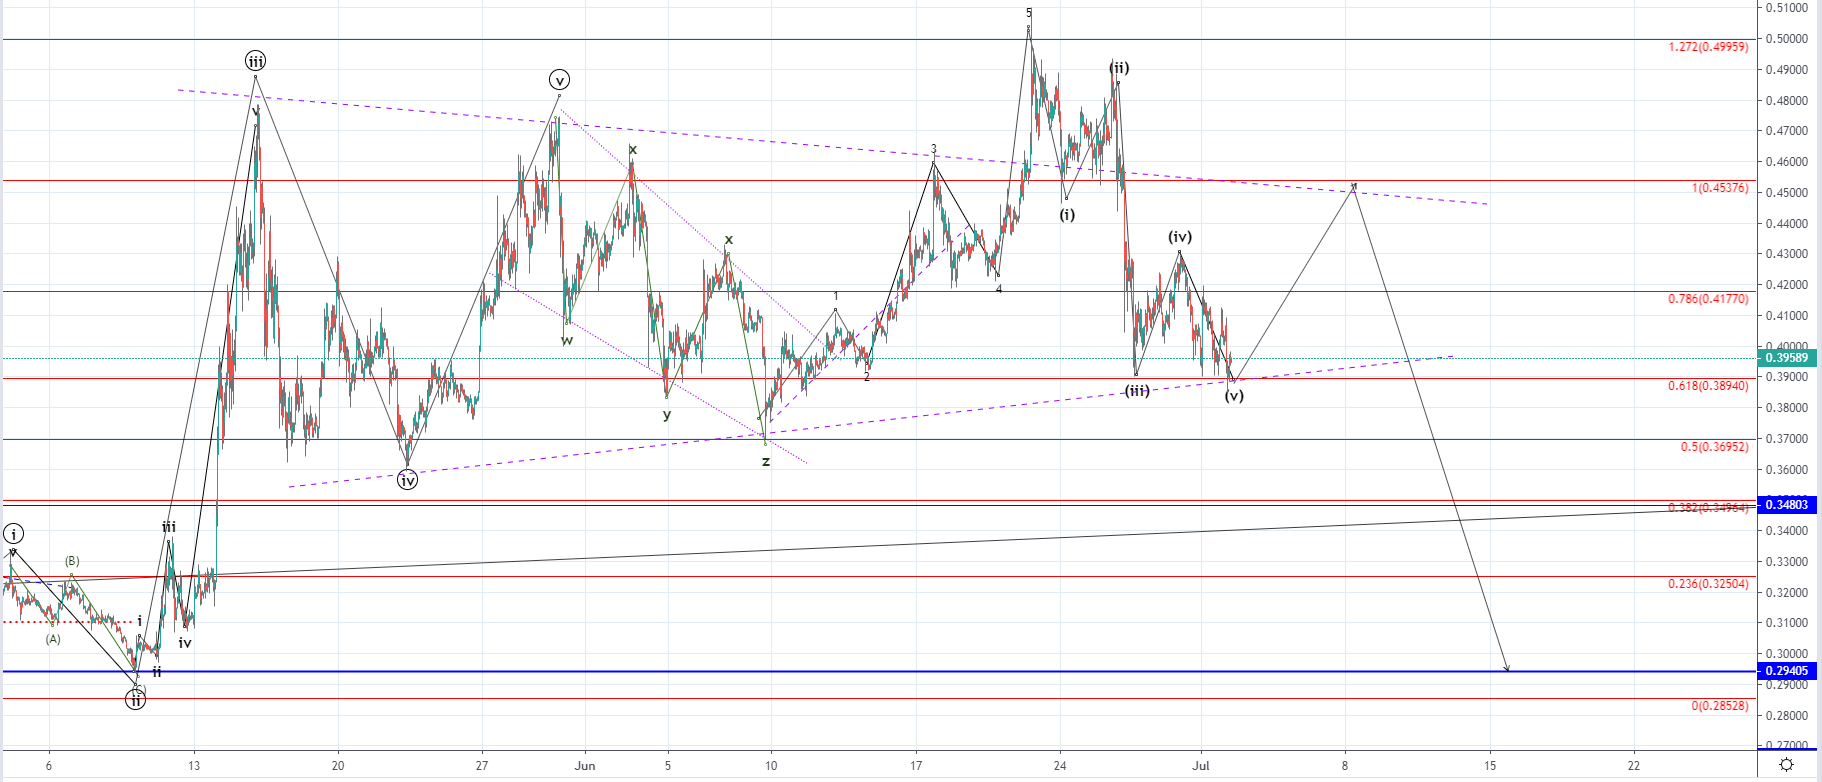
The price is currently being traded at around $0.39589 as it found support at the 0.618 Fibonacci level from which it bounced but this might end as another downfall as we are most likely seeing the development of the 5th wave from the starting downtrend. This 5th wave could have ended on the Fibonacci level with the price now starting another recovery and considering that the price decrease ended around the still unconfirmed ascending trendline which is the support level from the unconfirmed symmetrical triangle from 16th of May some upside movement could be seen.
I would be expecting this upside recovery to end around the vicinity of the 1 Fibonacci level where the resistance level of the symmetrical triangle is making an intersection and is most likely to serve as a strong resistance point. This would only be a small recovery before a breakout to the downside from the symmetrical triangle potentially all the way down to $0.29405 as its the most significant support level.
Prior to the decreasing impulse, the one to the upside was made reaching the 1.272 at $0.5 which was most likely the ending wave of the previous increase. Another possibility would be that the refereed increase is the part of the same correctional structure from 16th of May in which case we could have seen the completion of the five-wave correction. If this is true, then the price of Ripple is to shorty start another impulse wave to the upside and breakout from the unconfirmed symmetrical triangle’s resistance but considering the market’s sentiment, I don’t believe that’s likely.
FXOpen offers the world's most popular cryptocurrency CFDs*, including Bitcoin and Ethereum. Floating spreads, 1:2 leverage — at your service (additional fees may apply). Open your trading account now or learn more about crypto CFD trading with FXOpen.
*Important: At FXOpen UK, Cryptocurrency trading via CFDs is only available to our Professional clients. They are not available for trading by Retail clients. To find out more information about how this may affect you, please get in touch with our team.
This article represents the opinion of the Companies operating under the FXOpen brand only. It is not to be construed as an offer, solicitation, or recommendation with respect to products and services provided by the Companies operating under the FXOpen brand, nor is it to be considered financial advice.
Stay ahead of the market!
Subscribe now to our mailing list and receive the latest market news and insights delivered directly to your inbox.


Latest articles

EUR/USD Eyes Gains As USD/CHF Weakness Deepens Again
EUR/USD started a fresh increase above 1.1700 and 1.1720. USD/CHF declined further and is now struggling below 0.7835.
Important Takeaways for EUR/USD and USD/CHF Analysis Today
· The Euro started a decent increase from

Apple: Earnings Day Above the Activity Zone
On 30 April, after the market close, Apple Inc. will release its financial results for the second quarter of fiscal 2026. The consensus forecast, based on estimates from 31 analysts, points to revenue of around $109.7 billion, with expected

USD/JPY and USD/CHF Near Key Levels: The Dollar Supported by the Fed
The US dollar continues to trend upwards following the Federal Reserve meeting, drawing support from the regulator’s moderately hawkish stance and comments by Jerome Powell. Markets interpret the Fed’s rhetoric as a signal that restrictive policy is likely