


BTC/USD and XRP/USD moving sideways
FXOpen

BTC/USD
From yesterday’s low at $9160 the price of Bitcoin increased by 3.78% measured to the hourly candle close at its highest point today which is at around $9500. Since last Wednesday when the price came just below the 1 Fib level we have seen the formation of an ascending channel and the price retested its resistance level yesterday with a wick from the upper side of the hourly candle. As resistance has present the price started moving to the downside again and retested its support level finding support there which proved the channels’ relevance once more. 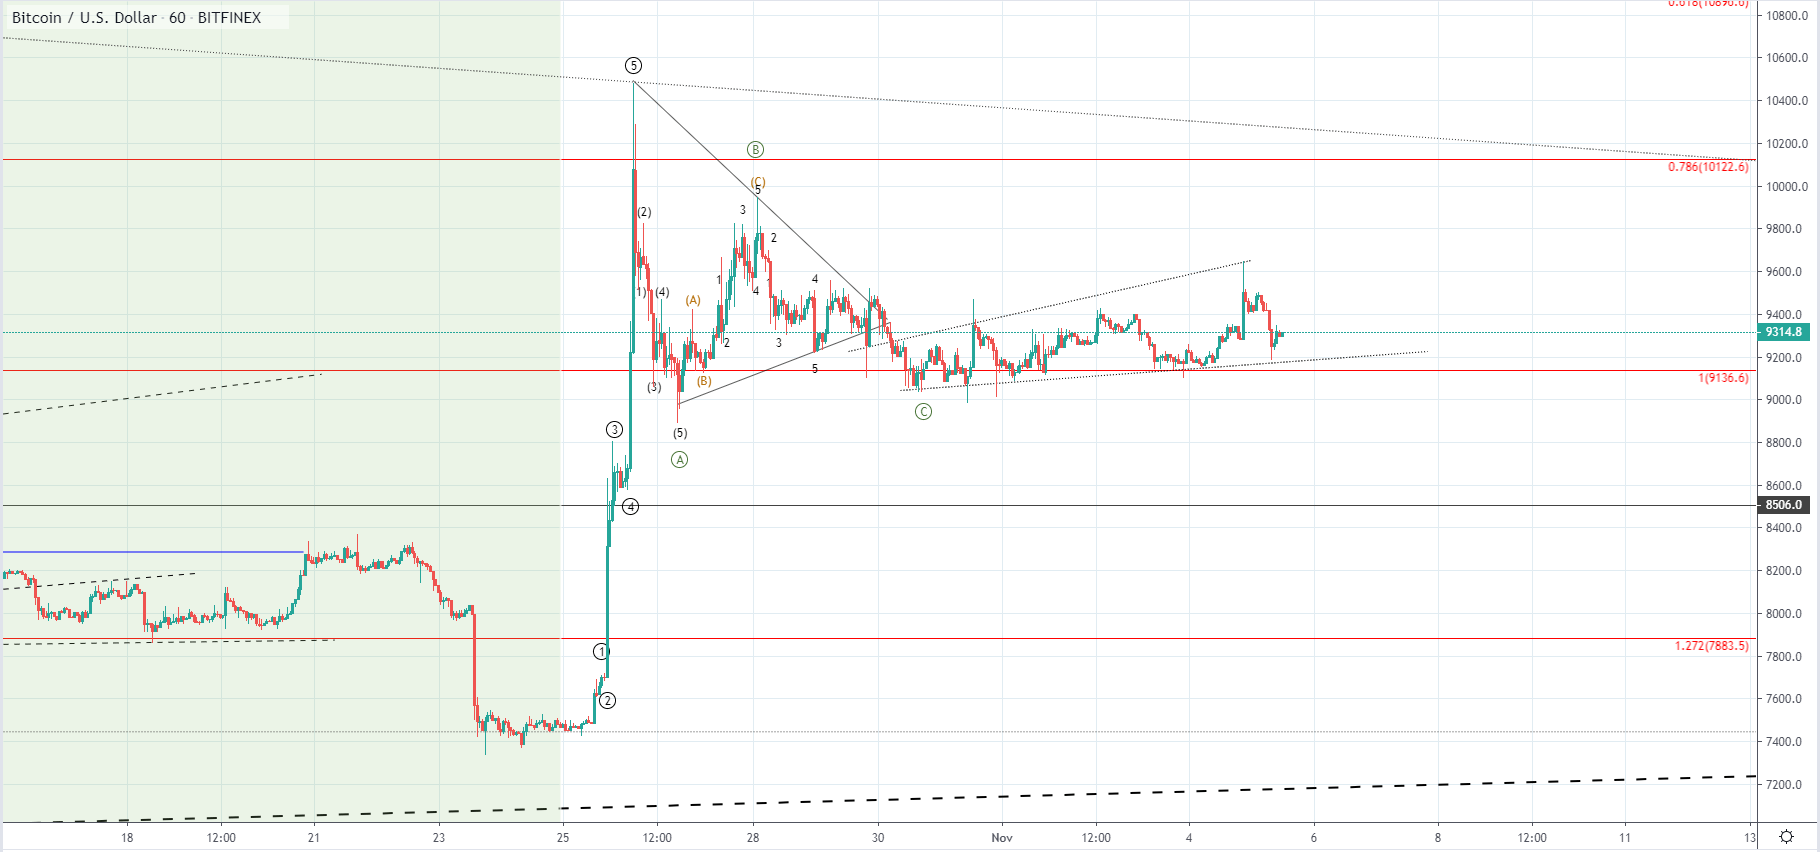 As you can see from the hourly chart prior to the formation of the ascending channel we have seen a symmetrical triangle from which the price made a breakout from the downside but hasn’t gone below the significant Fib level at $9136 as it serves as support. We could have seen the completion of the ABC correction after an impulsive move to the upside ended but the C wave just came slightly above the ending point of the wave A which isn’t as assuring.
Another possibility would be that the ascending channel is the 2nd structure out of the three-wave move to the downside in which case a breakout below the 1 Fib level would be seen and is why the level serves as a pivot point.
XRP/USD
The price of Ripple has increased from yesterday’s low at $0.2903 by 5.55% as it came up to $0.3064 at its highest point today. Currently, the price is being traded slightly below the $0.3 mark but the price is in an upward trajectory overall.
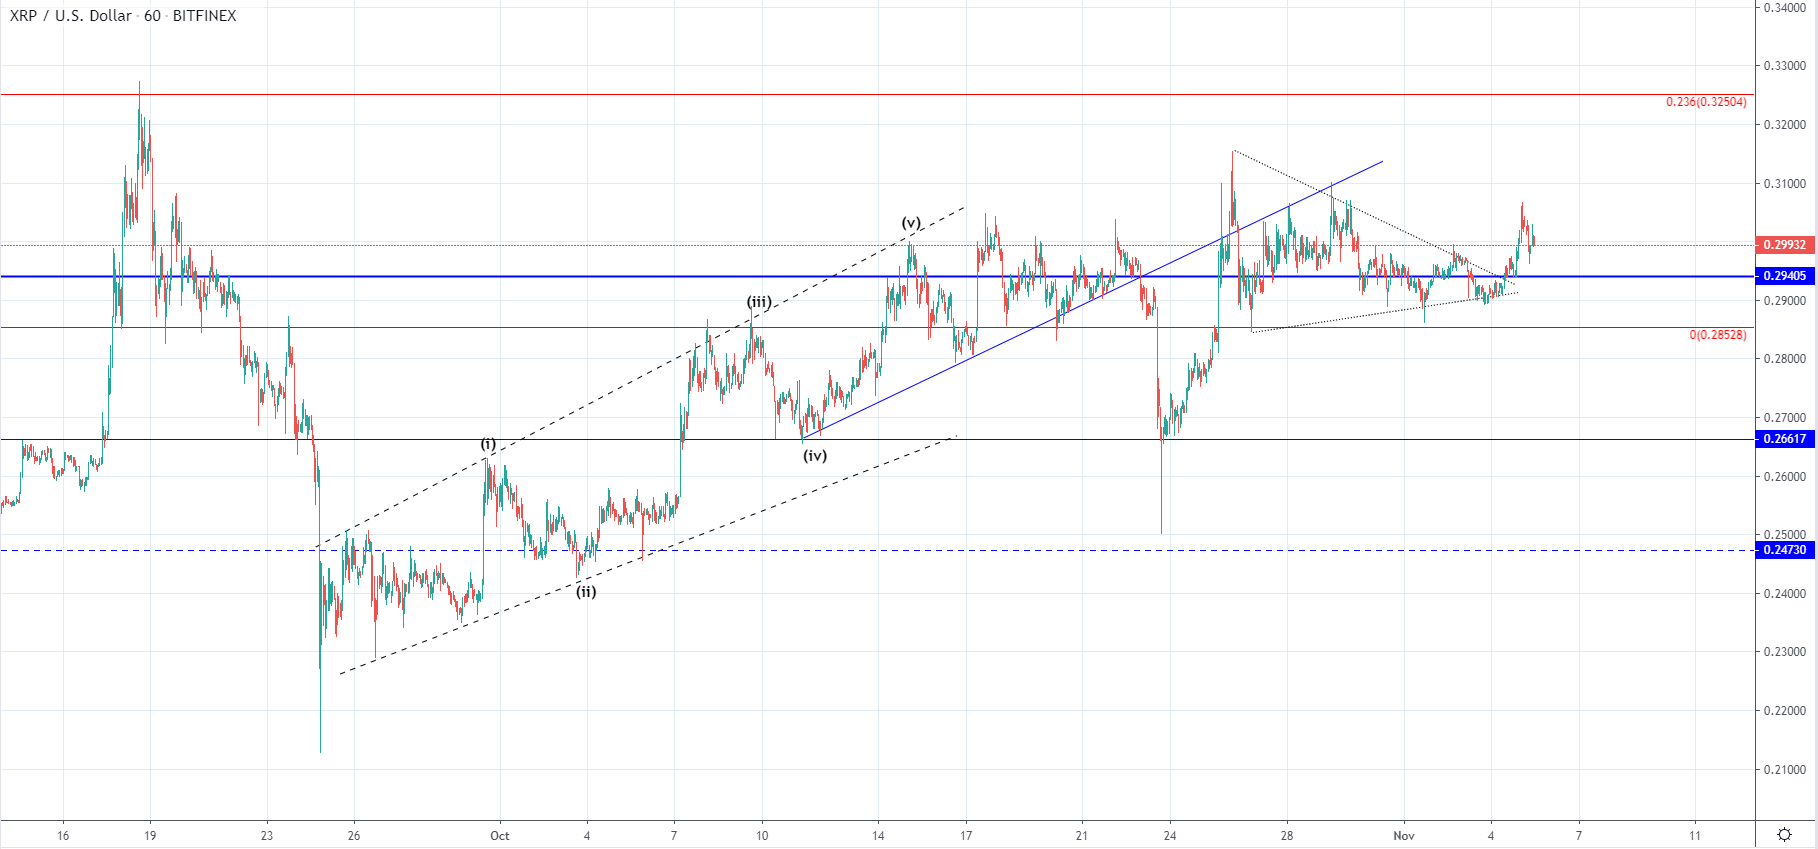
On the hourly chart, you can see that the price made a breakout from the triangle which formed after the second attempt for the price to maintain above the significant horizontal level at $0.29405 failed. As the price has shown signs of bullishness after it managed to hold above 0 Fib level the seen increase could be the first sign that the price is to hold above the horizontal support but we could be seeing another corrective increase that is to retest the seller’s territory above.
Considering that the price hasn’t made a higher high compared to the one made on the 26th of October when the second attempt has been made we still cannot say that the price broke the mentioned horizontal level. If the price continues moving to the upside from here and makes an interaction with the next Fib level in line at around $0.325 it would be a good sign, but if the price doesn’t manage to exceed the $0.309 high before falling below the 0 Fib level again it would most likely indicate further downside for the price of Ripple in the upcoming period.
FXOpen offers the world's most popular cryptocurrency CFDs*, including Bitcoin and Ethereum. Floating spreads, 1:2 leverage — at your service (additional fees may apply). Open your trading account now or learn more about crypto CFD trading with FXOpen.
*Important: At FXOpen UK, Cryptocurrency trading via CFDs is only available to our Professional clients. They are not available for trading by Retail clients. To find out more information about how this may affect you, please get in touch with our team.
This article represents the opinion of the Companies operating under the FXOpen brand only. It is not to be construed as an offer, solicitation, or recommendation with respect to products and services provided by the Companies operating under the FXOpen brand, nor is it to be considered financial advice.
Stay ahead of the market!
Subscribe now to our mailing list and receive the latest market news and insights delivered directly to your inbox.


Latest articles

EUR/USD Eyes Gains As USD/CHF Weakness Deepens Again
EUR/USD started a fresh increase above 1.1700 and 1.1720. USD/CHF declined further and is now struggling below 0.7835.
Important Takeaways for EUR/USD and USD/CHF Analysis Today
· The Euro started a decent increase from

Apple: Earnings Day Above the Activity Zone
On 30 April, after the market close, Apple Inc. will release its financial results for the second quarter of fiscal 2026. The consensus forecast, based on estimates from 31 analysts, points to revenue of around $109.7 billion, with expected

USD/JPY and USD/CHF Near Key Levels: The Dollar Supported by the Fed
The US dollar continues to trend upwards following the Federal Reserve meeting, drawing support from the regulator’s moderately hawkish stance and comments by Jerome Powell. Markets interpret the Fed’s rhetoric as a signal that restrictive policy is likely