


BTC/USD and XRP/USD recover, but for how long?
FXOpen

BTC/USD
Last Monday the price of Bitcoin was $10503 and spiked further to $10675 at its highest point. From there the price has decreased by 10.41% as it came down to its lowest point at $9417.9 on Thursday. As the price came down to its significant horizontal support level last Thursday and found support there a recovery has been seen of around 11% as it came up to the same levels as on last Monday.
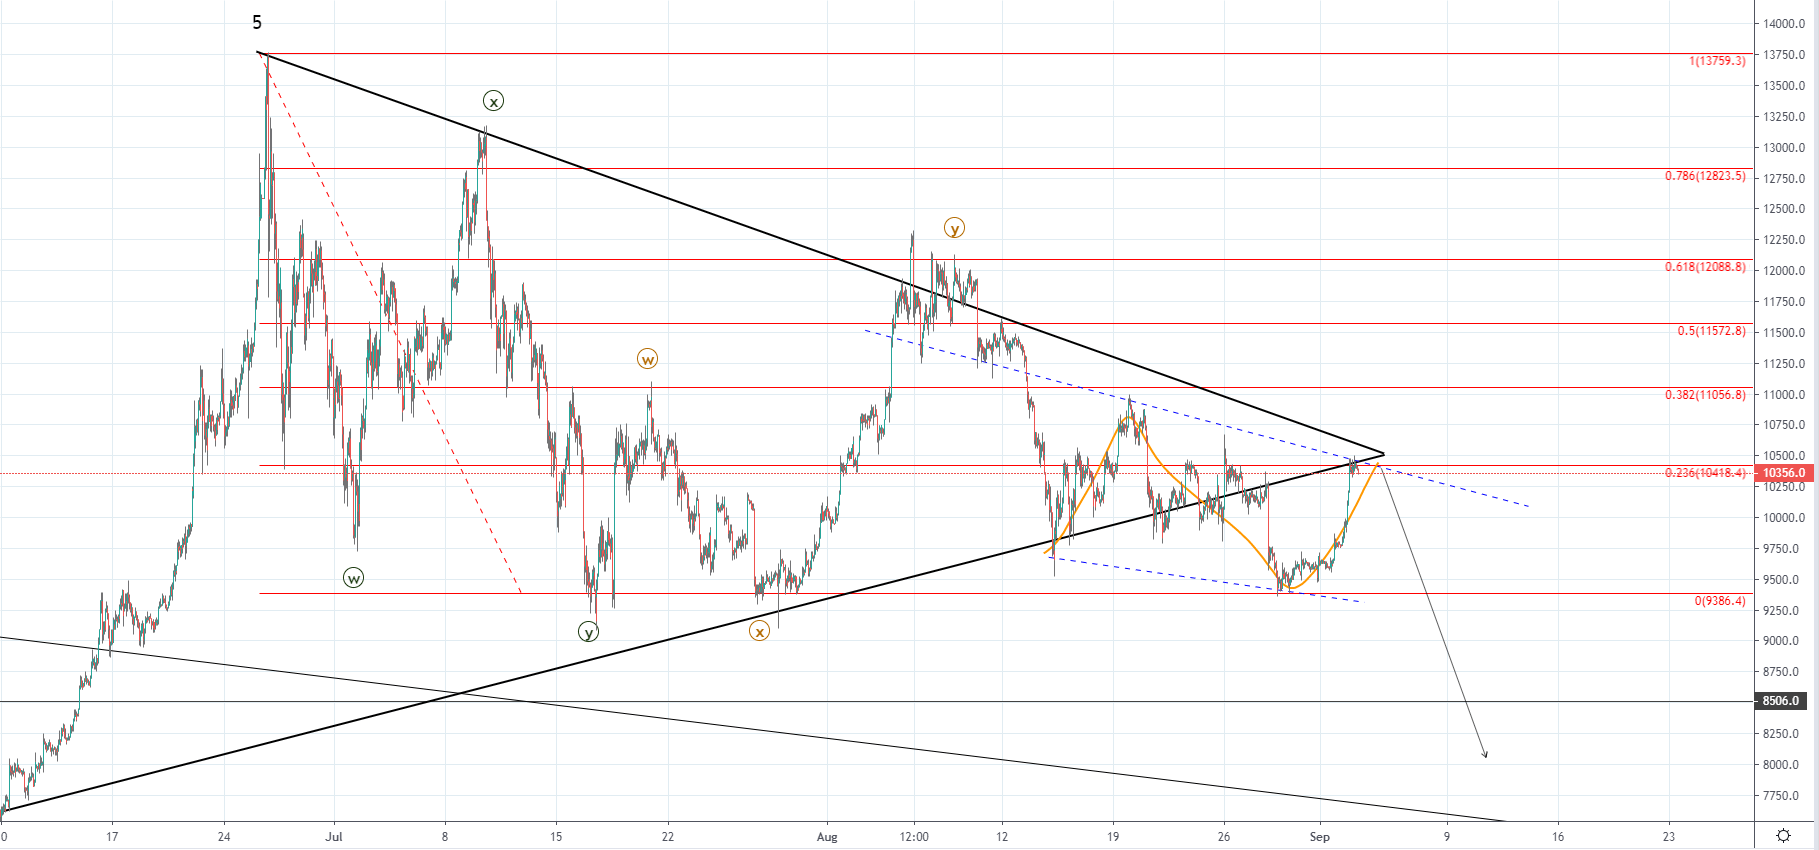 As you can see from the hourly chart, the price has started to break out to the downside from the symmetrical triangle which was formed since the 26th of June but it found support on the previous low levels at 0 Fibonacci line which has caused a bounce to the 0.236 Fib level and is currently retesting the broken triangle’s support.
If the price gets rejected at the current levels it could be interpreted as a retest of the broken support which is set to cause another downfall with the price most likely going below the 0 Fib level which served as support potentially to around the $8500 area which serves as a the lower horizontal support level but if the breakout momentum increases it will likely not hold. As we’ve seen two WXY corrections the current structure is likely the third one which could either be a five-wave move or another three-wave correction but in either way from here I would be expecting further downside from here.
XRP/USD
The price of Ripple was $0.27788 at its highest point on Monday from where we’ve seen a decrease of 10.34% at its lowest point to $0.249 made on Thursday but as the price came down to its lower horizontal support level and found support there a minor recovery has been seen of around 6% as the price came up to $0.2645.
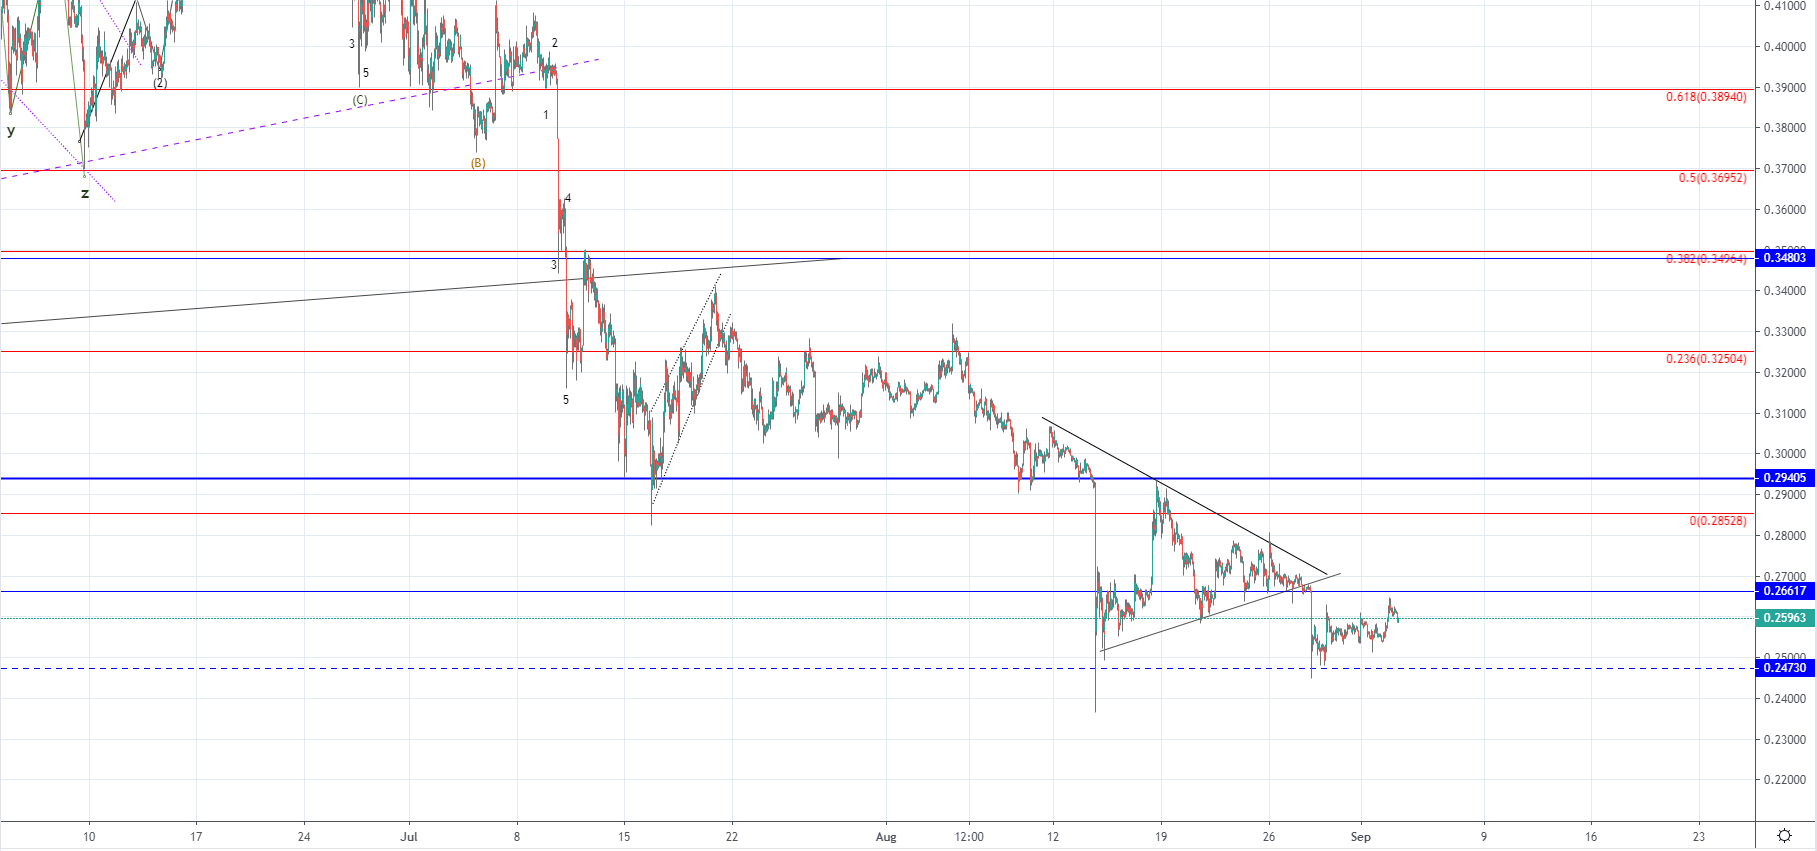 Looking at the hourly chart, you can see that similarly like in the case of Bitcoin the price of Ripple has broken out off of the symmetrical triangle and started moving to the downside but made a recovery to its broken horizontal level for a retest. Unlike in the case of Bitcoin, the recovery seen is a minor one which could mean that the recovery would continue but as the price reached the vicinity of the upper horizontal support which now serves as resistance we could see a rejection.
If the price gets rejected at the upper horizontal level at $0.26617 we could see further downside for the price of Ripple but if the price manages to move above it and stays there we could see the recovery continuing to the most significant one at $0.29405.
FXOpen offers the world's most popular cryptocurrency CFDs*, including Bitcoin and Ethereum. Floating spreads, 1:2 leverage — at your service (additional fees may apply). Open your trading account now or learn more about crypto CFD trading with FXOpen.
*Important: At FXOpen UK, Cryptocurrency trading via CFDs is only available to our Professional clients. They are not available for trading by Retail clients. To find out more information about how this may affect you, please get in touch with our team.
This article represents the opinion of the Companies operating under the FXOpen brand only. It is not to be construed as an offer, solicitation, or recommendation with respect to products and services provided by the Companies operating under the FXOpen brand, nor is it to be considered financial advice.
Stay ahead of the market!
Subscribe now to our mailing list and receive the latest market news and insights delivered directly to your inbox.


Latest articles

Meta: V-Shaped Recovery Meets Heavy Volume Resistance
The movement in Meta Platforms shares is being driven by two competing narratives. On one hand, advertising revenue is benefiting from AI-based tools: the Advantage+ platform continues to support strong advertiser demand, and the analyst consensus for Q1 2026 revenue

Commodity Currencies Test Key Levels Ahead of Major Macro Data
Commodity-linked currencies are trading near key levels, showing restrained price action as market participants adopt a wait-and-see approach. The fundamental backdrop is shaped by expectations surrounding the release of Australia’s inflation data and the Bank of Canada’s interest

Microsoft Shares Two Days Ahead of Earnings Release
In January, Microsoft shares came under pressure following the company’s earnings report. Although both revenue and earnings per share exceeded analysts’ expectations, growth in the Azure cloud platform slowed to 39% year-on-year from 40% in the previous quarter—enough