


BTC/USD and XRP/USD show strong bullish momentum
FXOpen
BTC/USD
From yesterday when the price of BTC was at $4163 the BTC/USD pair has increased by 22.7% today measured to the highest point the price has been which is at $5108.
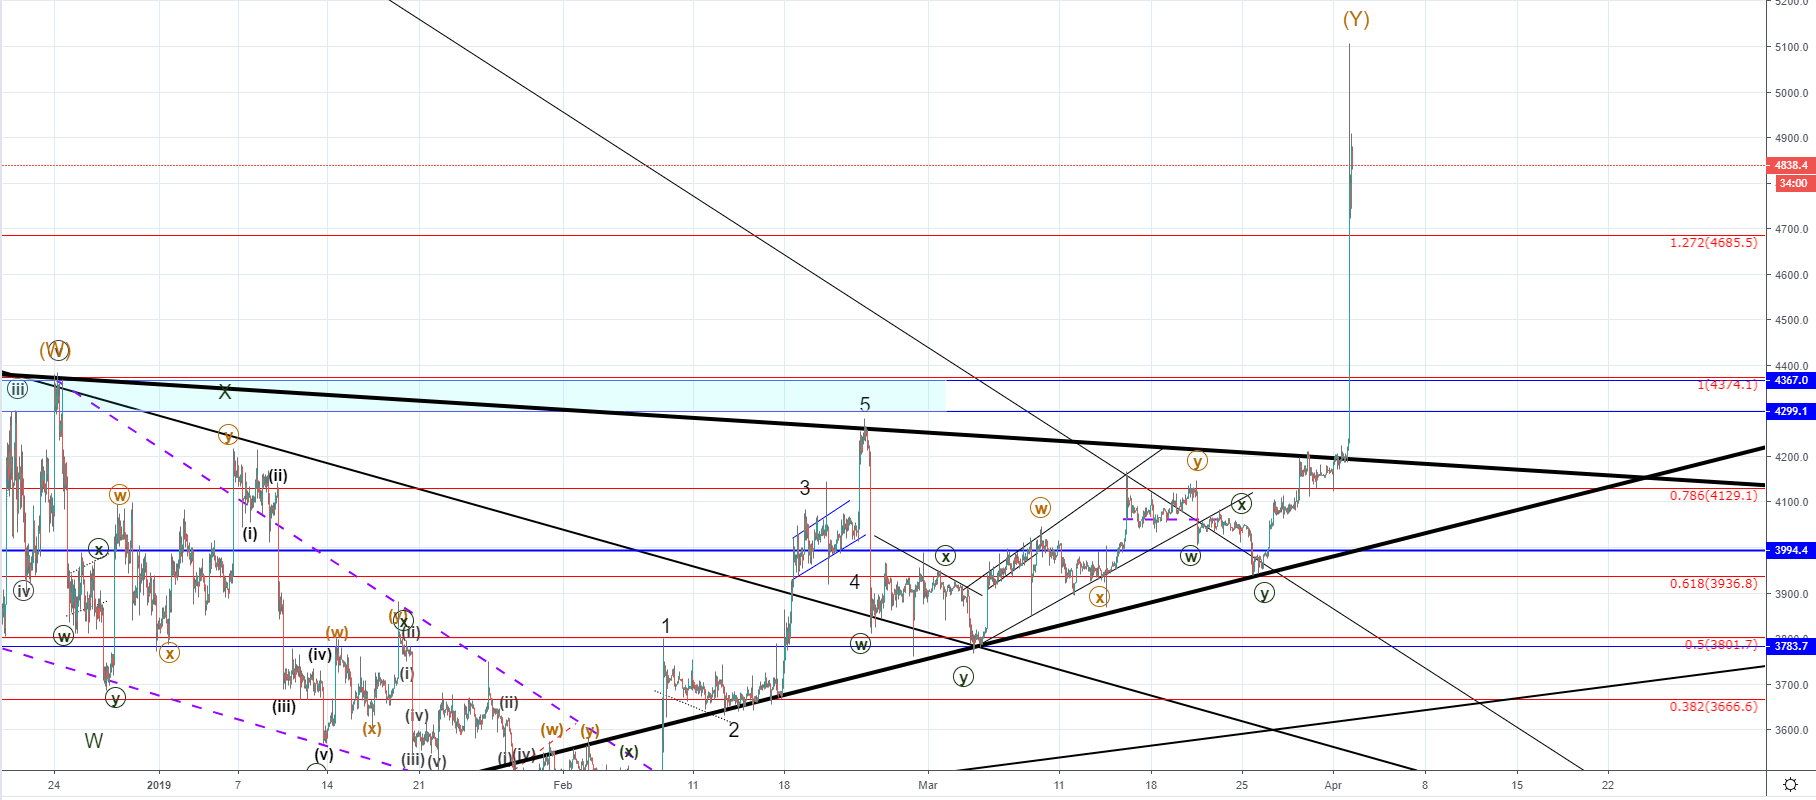
On the hourly chart, you can see that the price came to the descending trendline on Saturday when the interaction has been made. Then a minor retracement occurred to the 0.786 Fibonacci level where the price found support on a quick spike as it came back to the significant resistance level and was hovering around before finally going above it slightly, retested it from the upside. After that strong momentum was shown to the upside as the price increased impulsively and parabolically.
I was expecting that the interaction with the significant resistance level would end as a rejection with the price going down first to establish support on the lower ascending trendline around $3666 before we see a breakout to the upside. But instead, the price continued moving to the upside and has managed to break major key resistance levels along the way.
This bullish momentum could be the continuation of the Intermediate Y wave and as the price spiked to just little over $5100 and retraced by around 7% after we are now seeing the first signs of the momentum slowing down. From today’s highest point the price has retraced by 7.48% but has started increasing again and is currently 5.25% lower then on its highest point which could be an early indication that the momentum would continue.
As the price has increased exponentially we are now most likely to see consolidation above the 1.272 Fibonacci level which will now most likely get tested for support.
XRP/USD
The price of Ripple has increased by 10.44% from yesterday’s open at $0.31367 measured to its highest point today at $0.34641.
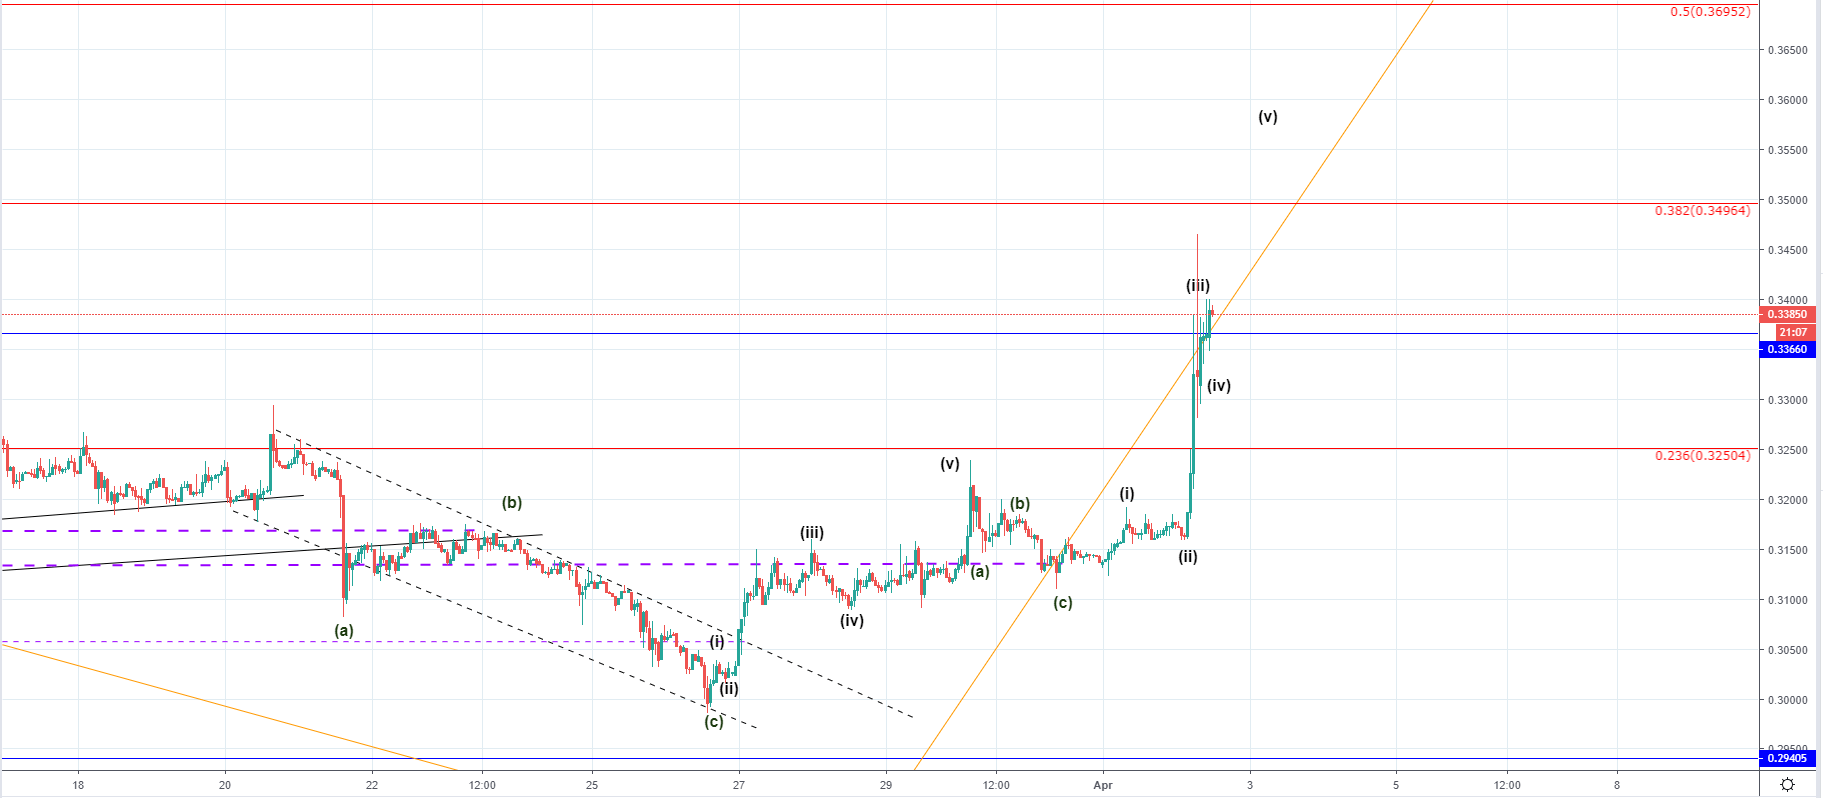 On the hourly chart, we can see that the price of Ripple came above the horizontal resistance level at $0.3366 but hasn’t come to the 0.382 Fibonacci level yet. Hence, further increase would be expected as the price action is to complete its five-wave pattern. Currently, we are seeing the signs of a struggle around the mentioned horizontal resistance level but as the price is still above it which can be viewed as a good sign.
The level is most likely going to serve as support but further retesting would be needed, and considering that we have most likely seen the development of the 3rd wave, now the 4th wave could develop above the level which would mean that now we could see some consolidation before another runup.
FXOpen offers the world's most popular cryptocurrency CFDs*, including Bitcoin and Ethereum. Floating spreads, 1:2 leverage — at your service (additional fees may apply). Open your trading account now or learn more about crypto CFD trading with FXOpen.
*Important: At FXOpen UK, Cryptocurrency trading via CFDs is only available to our Professional clients. They are not available for trading by Retail clients. To find out more information about how this may affect you, please get in touch with our team.
This article represents the opinion of the Companies operating under the FXOpen brand only. It is not to be construed as an offer, solicitation, or recommendation with respect to products and services provided by the Companies operating under the FXOpen brand, nor is it to be considered financial advice.
Stay ahead of the market!
Subscribe now to our mailing list and receive the latest market news and insights delivered directly to your inbox.


Latest articles

EUR/USD Eyes Gains As USD/CHF Weakness Deepens Again
EUR/USD started a fresh increase above 1.1700 and 1.1720. USD/CHF declined further and is now struggling below 0.7835.
Important Takeaways for EUR/USD and USD/CHF Analysis Today
· The Euro started a decent increase from

Apple: Earnings Day Above the Activity Zone
On 30 April, after the market close, Apple Inc. will release its financial results for the second quarter of fiscal 2026. The consensus forecast, based on estimates from 31 analysts, points to revenue of around $109.7 billion, with expected

USD/JPY and USD/CHF Near Key Levels: The Dollar Supported by the Fed
The US dollar continues to trend upwards following the Federal Reserve meeting, drawing support from the regulator’s moderately hawkish stance and comments by Jerome Powell. Markets interpret the Fed’s rhetoric as a signal that restrictive policy is likely