


BTC/USD and XRP/USD showing sings of bullishness
FXOpen
BTC/USD
Last Friday, the price of Bitcoin has been sitting around $7913 at its lowest point as it was in a downtrend all throughout last week. But since the price retested the 1.272 Fibonacci level it started increasing again and managed to recover by 4.72%, coming to $8300 at its highest point today. 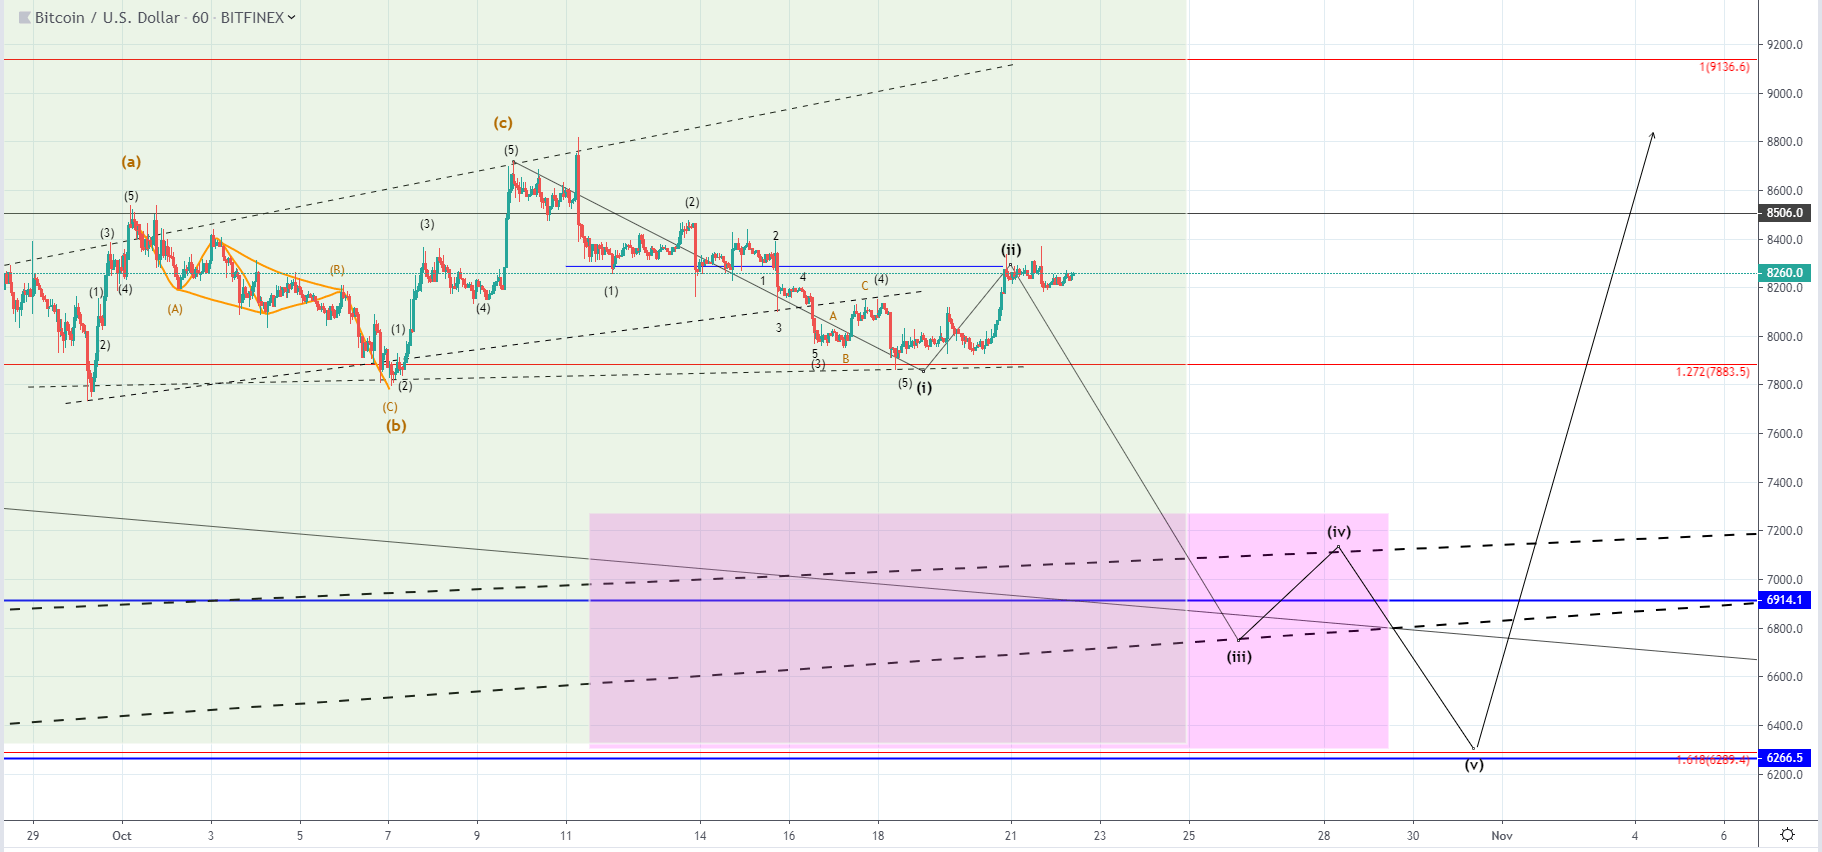 On the hourly chart, you can see that the price increase was expected to play out as a 2nd wave out of the next five-wave move to the downside which is expected to lead the price of Bitcoin below $7000. This move to the downside should play out after the ABC correction to the upside ended but we are yet to see from the current interaction as if the price continues moving to the upside above the interacted level it could invalidate the count, especially if it comes to the vicinity of the labeled C wave.
If the price gets immediately rejected at the current levels and with showing signs of struggle indicated the candlestick on a couple of previous candles on the hourly chart, we are going to see a breakout to the downside below the 1.272 Fibonacci level and potentially on to the next one at 1.618.
XRP/USD
From last week when the price of Ripple came up to around the significant horizontal level at $0.29405, we have seen the price moving sideways. Currently, it is above the level and in an upward trajectory, but we can’t say that a breakout has been seen as it failed to exceed the prior high, made on the first attempt.
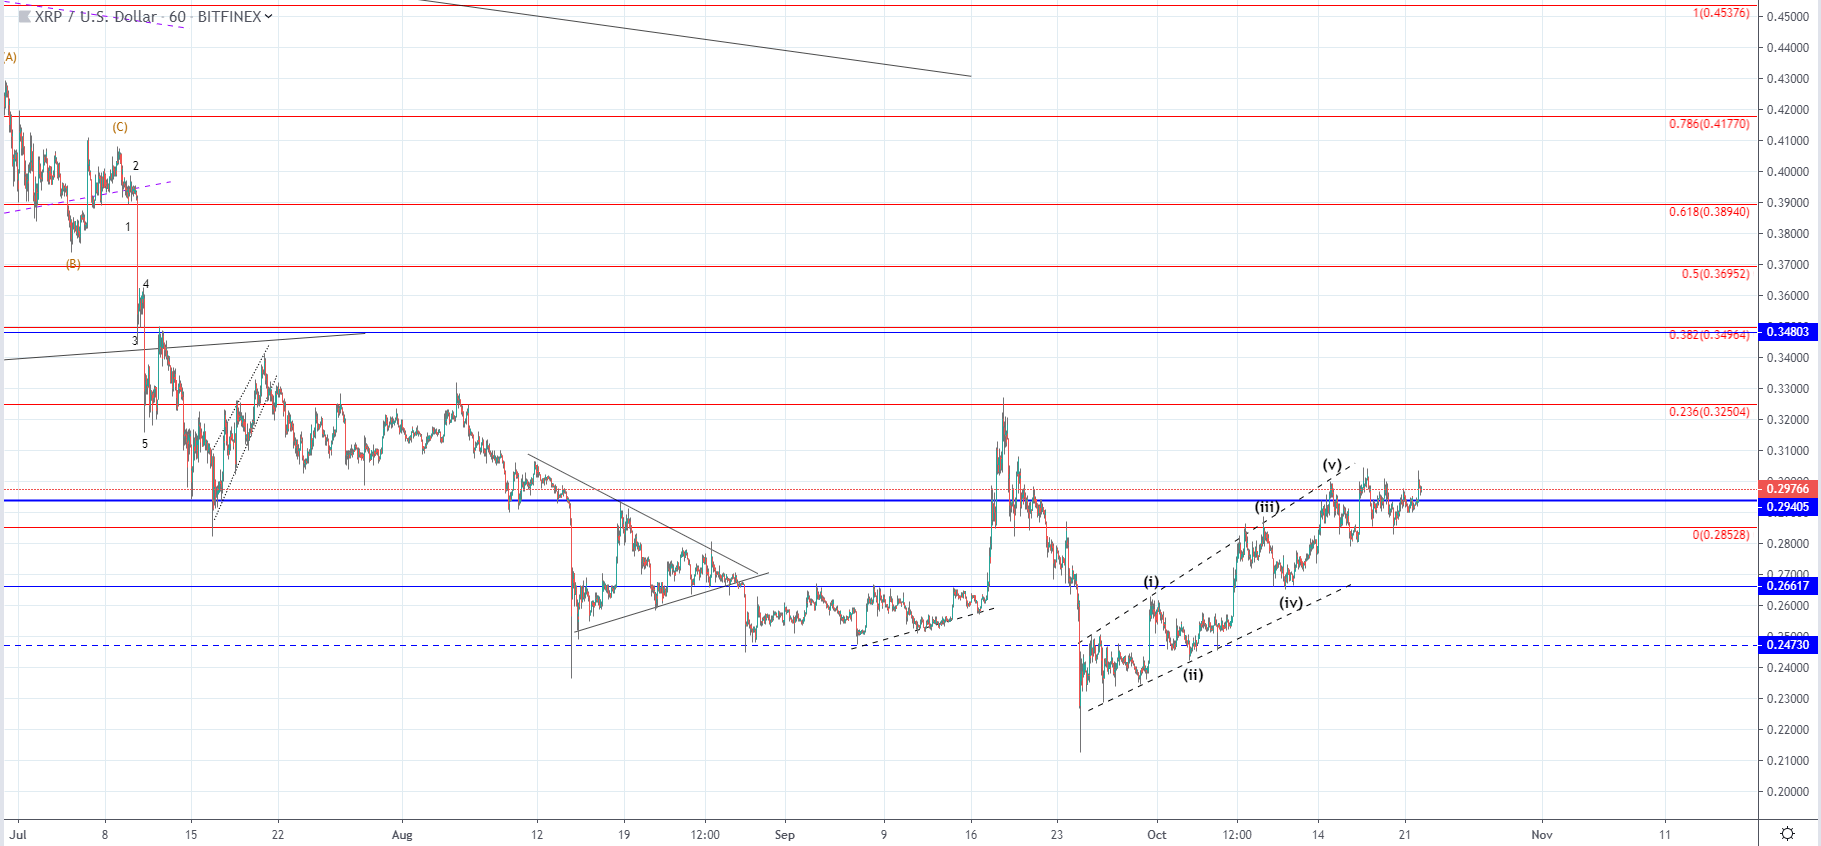 On the hourly chart, you can see that the price is still in an upward trajectory overall and is still inside the territory of the ascending channel formed from the $0.226 low. As I have counted five waves the move should either be the 1st wave of the higher degree five-wave move to the upside and considering the channel it could very be the first wave. But if we have seen the first wave ending now the second one should start developing to the downside and potentially retest the $0.247 level for support.
Looking at the price action it looks like the buyers are putting pressure on the current significant horizontal resistance so the move to the downside to $0.247 might not happen in which case it would be very difficult to say if it was the 2nd wave or not. In either way, I would be expecting a retracement from here after which a breakout to the upside should develop.
FXOpen offers the world's most popular cryptocurrency CFDs*, including Bitcoin and Ethereum. Floating spreads, 1:2 leverage — at your service (additional fees may apply). Open your trading account now or learn more about crypto CFD trading with FXOpen.
*Important: At FXOpen UK, Cryptocurrency trading via CFDs is only available to our Professional clients. They are not available for trading by Retail clients. To find out more information about how this may affect you, please get in touch with our team.
This article represents the opinion of the Companies operating under the FXOpen brand only. It is not to be construed as an offer, solicitation, or recommendation with respect to products and services provided by the Companies operating under the FXOpen brand, nor is it to be considered financial advice.
Stay ahead of the market!
Subscribe now to our mailing list and receive the latest market news and insights delivered directly to your inbox.


Latest articles

DAX 40: consolidation amid technology sell-off
A wave of selling in the technology sector that emerged earlier this week has weighed on European equities. The trigger was investor concern over the profitability of large-scale debt-funded investments by major US tech companies in AI infrastructure. The Nasdaq

Euro Hits Fresh Yearly Lows Amid Dovish ECB Signals
The euro remains under pressure following weak macroeconomic data from the euro area and fresh signals that the European Central Bank is prepared to maintain a more accommodative monetary policy stance. Data released yesterday pointed to a deterioration in business

Pound at Key Levels: Markets Assess Impact of Political Uncertainty in the UK
The British pound remains under pressure following increased political uncertainty in the United Kingdom triggered by the Prime Minister’s resignation. Investors are assessing potential shifts in the political and economic policy outlook after the head of government stepped down,