


BTC/USD and XRP/USD: Significant resistance encountered
FXOpen
BTC/USD
From yesterday’s low at $5939, the price of Bitcoin has come up by 5.8% today measured to the highest point the price has been which is at $6276 and even spiked a bit higher to $6330.
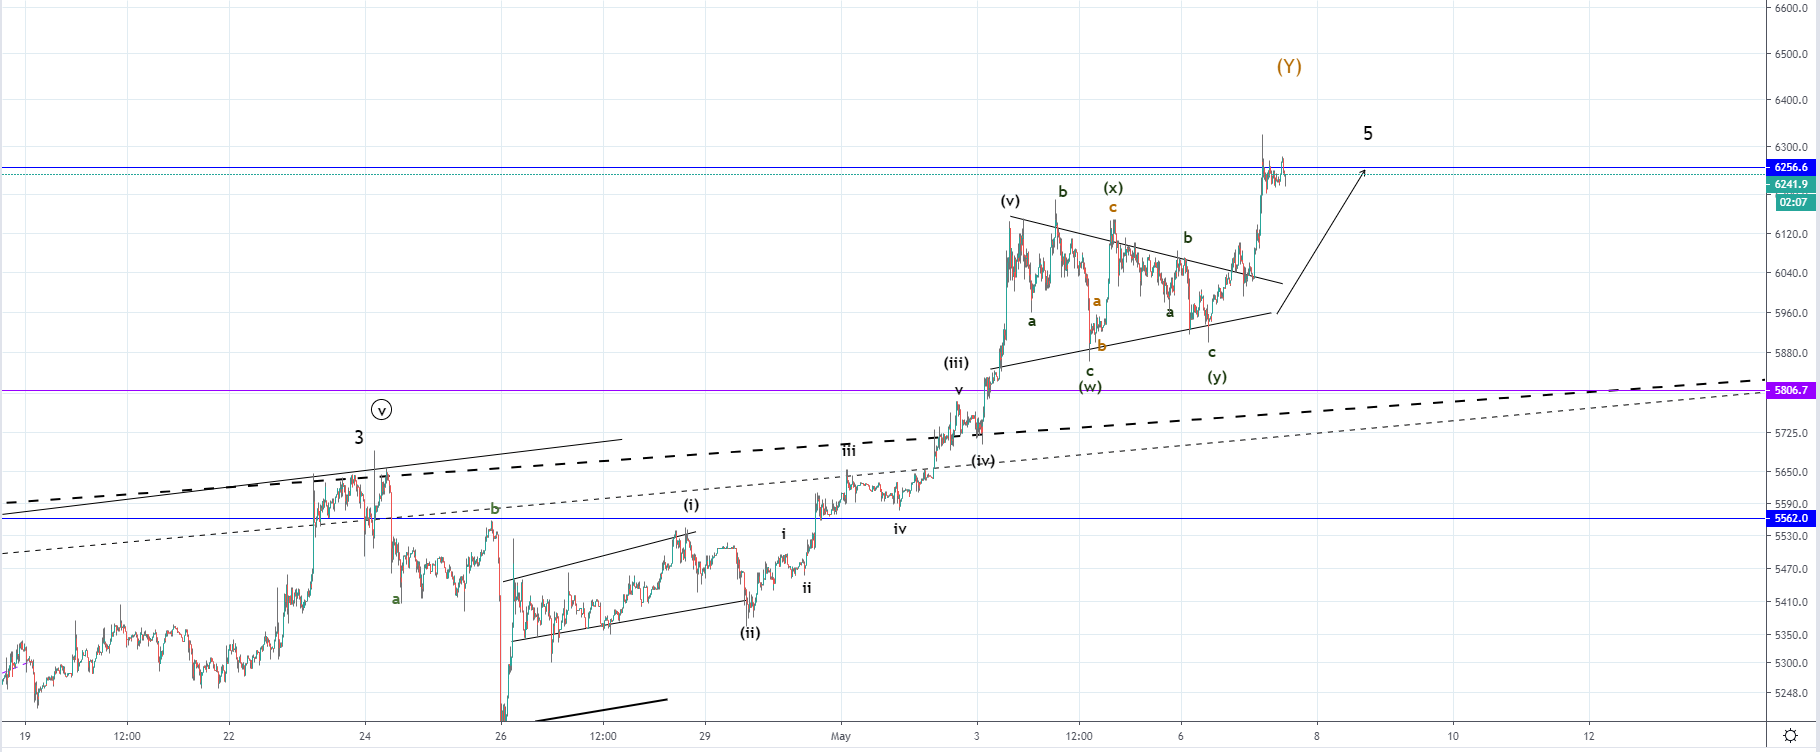
On the 15-min chart, we can see that the price of Bitcoin came up to its significant horizontal resistance level at $6256 where interaction has been made. As stated, the price spiked up above it but immediately went back below it and has started to form a cluster as the interaction is verifying the resistance level. This horizontal level is the significant support which was broken in November last year and is now likely getting retested on the correctional movement to the upside. It is worth noting that this chart is the one from Bitfinex and is fairly higher compared to the other exchanges like for example Coinbase on which the price is currently being traded at $5871.
This means that the interaction with the significant horizontal level was only made on the Bitfinex chart which is why we still can’t say that the projection got invalidated as this level serves as an invalidation level for the projected scenario in which we are seeing an Intermediate WXY correction to the upside out of which the current upside movement is the 5th wave from the Y wave.
As we’ve seen a breakout to the upside from the symmetrical triangle formed over the weekend further upside would be expected but the significant resistance has been encountered which is why we could see a rejection taking place.
XRP/USD
From yesterday’s low at $0.3104 the price of Ripple has increased by around 4% as it came up to $0.32286 at its highest point today. The price has retraced since and is currently being traded at $0.3176 and is in a downward trajectory. 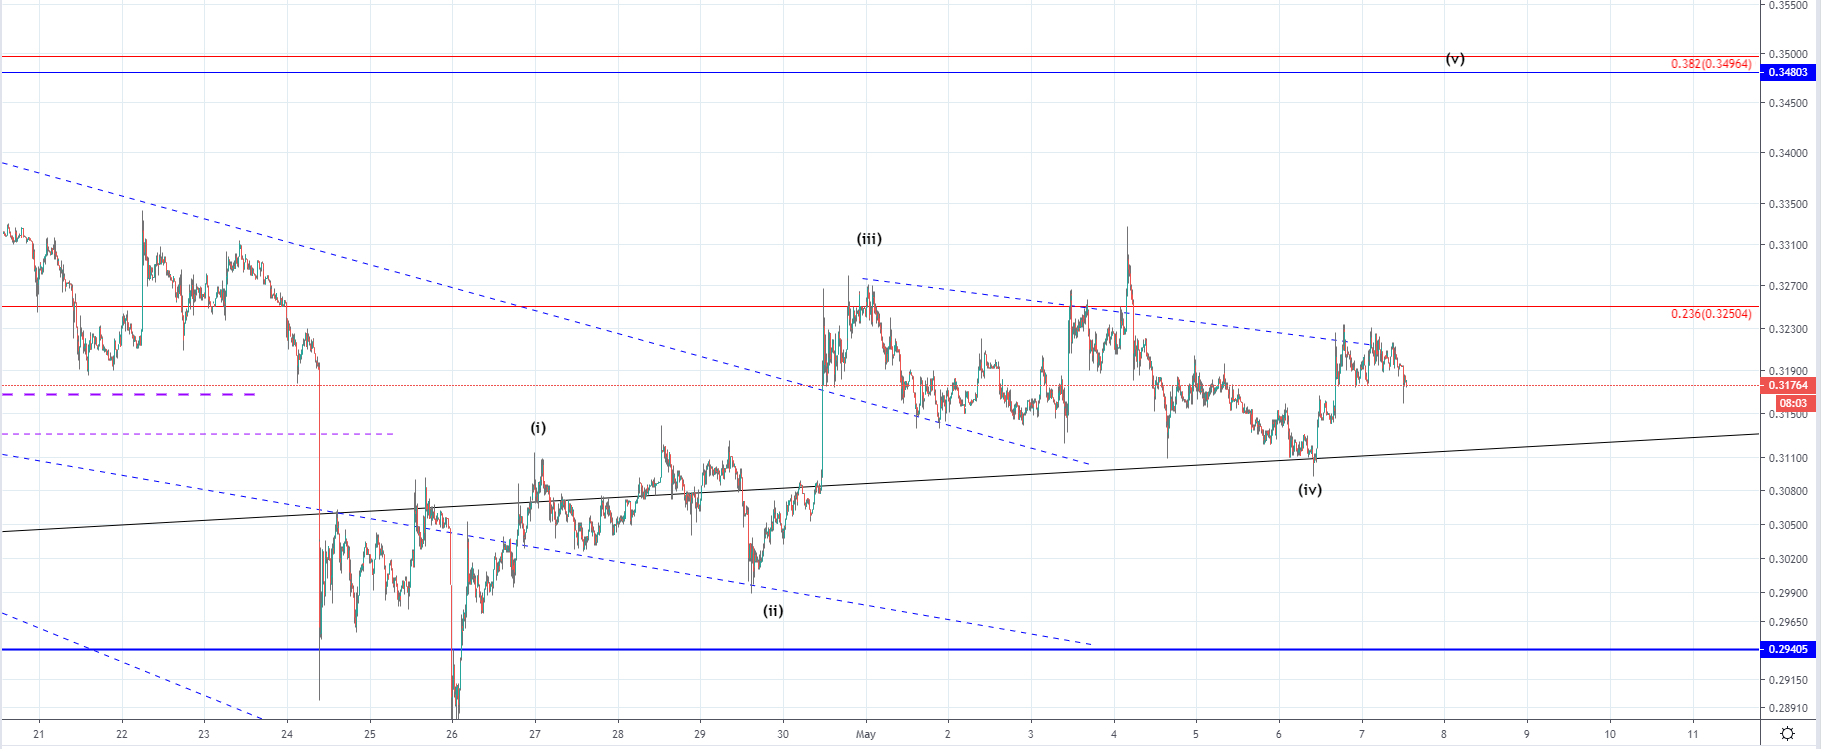
Looking at the 15-min chart you can see that an attempt for a breakout from the descending channel has been made but ended as a failure with the price retracing back inside the territory of the descending structure. Yesterday’s low was the interaction with the significant ascending trendline which is the baseline support from 207 and since it again served as support a bounce to the upside has been made which could be the first wave out of the next impulse wave to the upside.
If this is true than after the currently seen retracement would we could see another upside movement that is set to lead the price for a breakout to the upside but we could very well see another interaction with the baseline support in which case the price of Ripple would go back to $0.311 area before going to the 0.382 Fibonacci level at around $0.349.
FXOpen offers the world's most popular cryptocurrency CFDs*, including Bitcoin and Ethereum. Floating spreads, 1:2 leverage — at your service (additional fees may apply). Open your trading account now or learn more about crypto CFD trading with FXOpen.
*Important: At FXOpen UK, Cryptocurrency trading via CFDs is only available to our Professional clients. They are not available for trading by Retail clients. To find out more information about how this may affect you, please get in touch with our team.
This article represents the opinion of the Companies operating under the FXOpen brand only. It is not to be construed as an offer, solicitation, or recommendation with respect to products and services provided by the Companies operating under the FXOpen brand, nor is it to be considered financial advice.
Stay ahead of the market!
Subscribe now to our mailing list and receive the latest market news and insights delivered directly to your inbox.


Latest articles

WTI Analysis: Gap Breaks Short-Term Trend as Price Remains Trapped Between the POC and Profile Boundary
WTI crude oil plunged by more than 7% on 27 July 2026 after the US suspended a series of strikes against Iran over the weekend, raising hopes of a diplomatic solution and the reopening of shipping through the Strait of

US Dollar Index: A Defining Week for the King of the Markets
The dollar heads into a pivotal week trading near 101.80, just off a 15-month high, with the Fed's July 29 meeting standing as the clear focal point. Markets currently price roughly a 65% chance of a hold, though renewed

NZD/USD: Inflation Surge Meets Strong US Dollar Pressure
On 21 July, Stats NZ reported an acceleration in inflation: the Consumer Price Index rose 1.5% in the second quarter, while the annual inflation rate climbed to 4.1%, its highest level in more than two years and slightly