


BTC/USD continues increasing while XRP/USD showing signs of weakness.
FXOpen
BTC/USD
From last weeks Monday when the price of Bitcoin was sitting at $8986 at its lowest, we have seen an increase of 26.55% measured to the highest point the price has been today which is at $11372. The price continued increasing after yesterday’s pullback of around 4.87% which brought the price down to $10633 and is still in an upward trajectory.
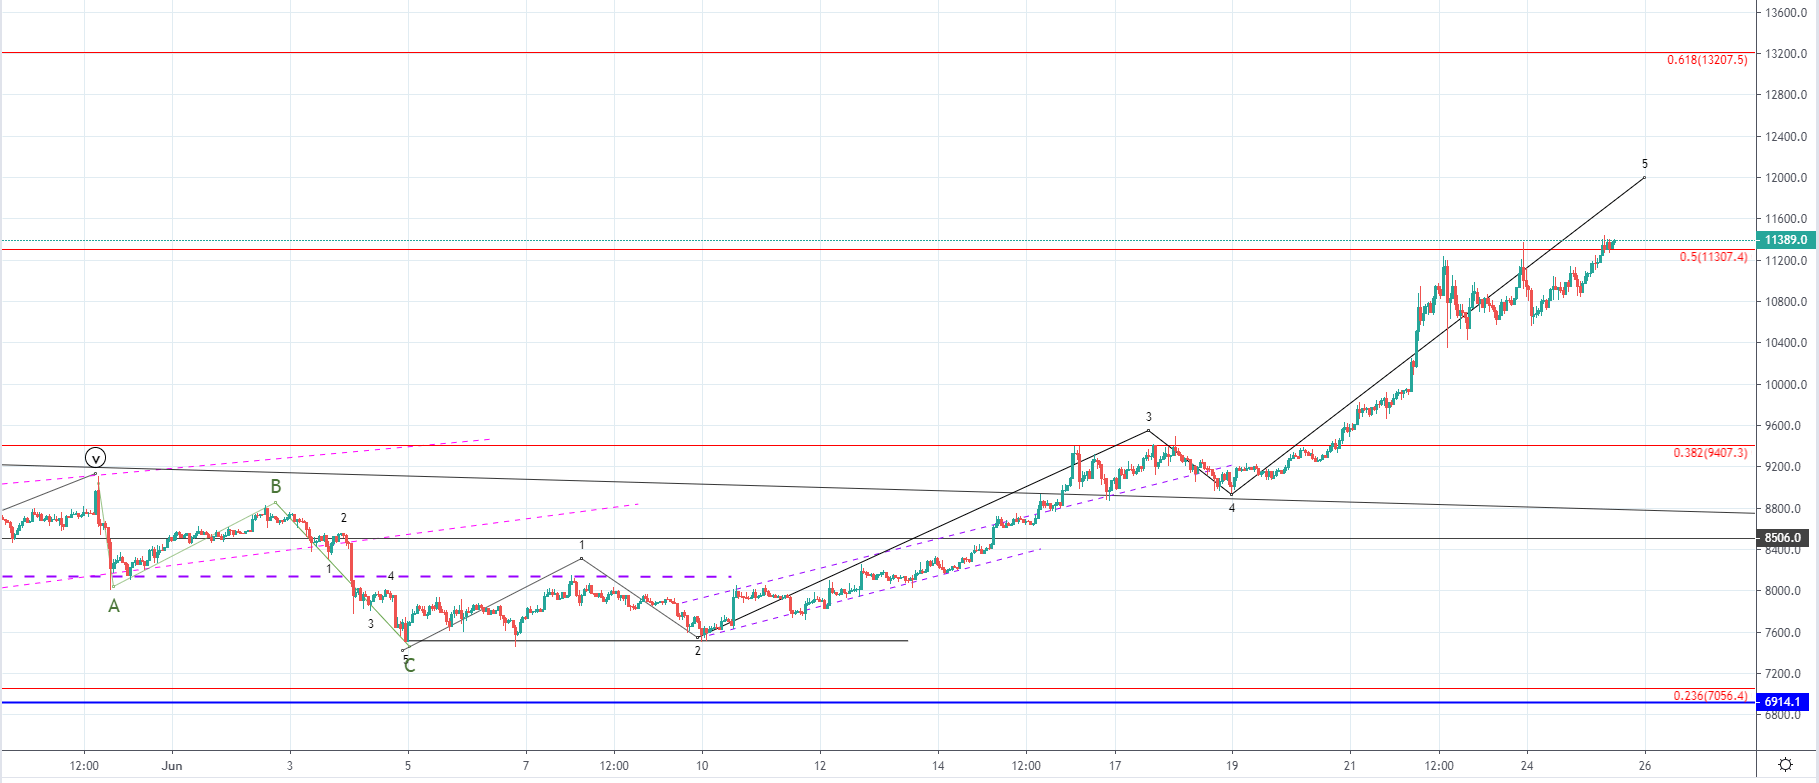
On the hourly chart, you can see that the price of Bitcoin came up to the 0.5 Fibonacci level and has been stopped out at the resistance found on those levels yesterday which is why we’ve seen the formation of the horizontal sideways range. But the pullback was only a minor one as the price continued increasing steadily after the retracement and is currently attempting to break out to the upside above the significant resistance point.
The price is currently above the 0.5 Fibonacci level and is retesting it for support. If the price finds support at the current levels further upside movement could be seen to the next significant Fib level of 0.618 which is in price terms at $13207. The wave structure implies that we are seeing the 5th wave of the five-wave impulse which started on 5th. This means that after some further upside correction is soon to be expected.
If the five-wave impulse from 5th is the ending wave of the impulse from the higher degree its completion would mark the end of the bullish rise we’ve seen from 15th of December. The price doesn’t find support around the current levels and starts falling down fast it would indicate that the buyer’s interest has gotten weaker than the seller’s pressure and would, in that case, indicate the end of the last five-wave impulse.
The bullish momentum doesn’t seem to be showing any signs of weakness which is why more likely we are to see further upside move before the downturn starts.
XRP/USD
Over the weekend the price of Ripple has increased by 15.6% coming from Friday’s low at $0.4233 to $0.4895 on the next day and spiked even higher, above $0.5. Since then the price has started decreasing and has come down by 7.3% on Monday as it came down to $0.454. From yesterday’s low, the price started increasing again and $0.4751 at its highest point today around which it is currently being traded.
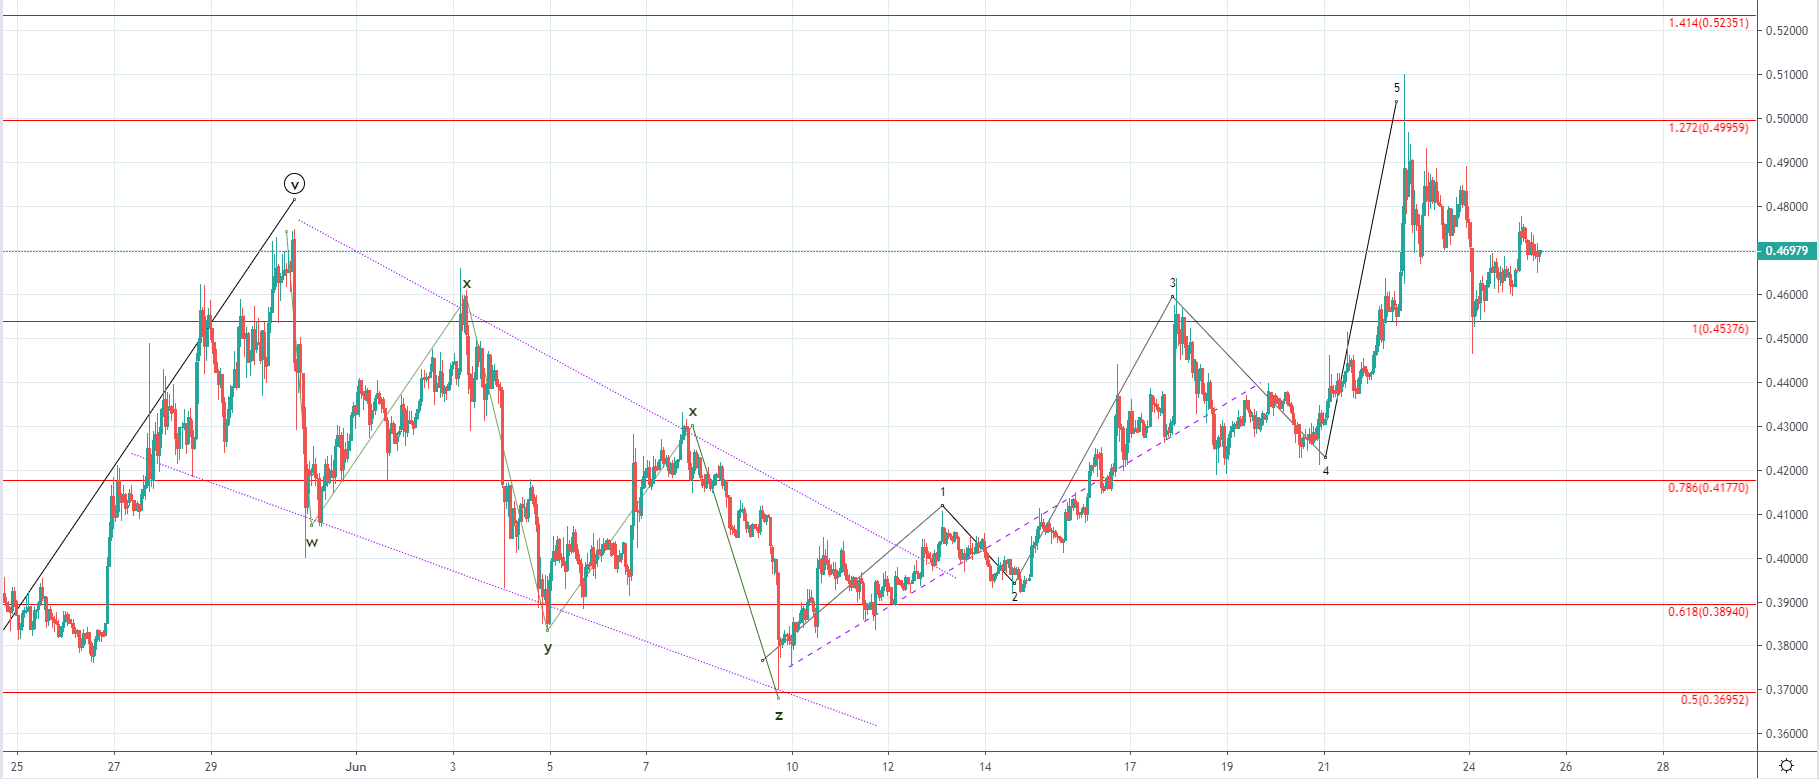 Looking at the hourly chart, you can see that the price of Ripple came up to the 1.272 Fibonacci level and attempted to surpass it but ended as a failure with the price action leaving a large wick on the hourly chart above the significant level. As the attempt ended as a failure the and strong resistance has been encountered we’ve seen a pullback of around 6% but in a sharp impulsive manner.
The wave structure implies that we have seen the completion of the five-wave impulse from Monday 10th of June which is why we are now most likely seeing a correction taking place. If this is true then the price has started developing the second wave out of the correctional move with the third one to the downside shortly to develop. This third wave would bring the price of Ripple below the 1 Fibonacci level which now serves as support.
Previous to the formation of the last five-wave move to the upside we’ve seen a descending channel inside which a five-wave correction to the downside developed. This WXYXZ correction has developed after the 5th wave of the Minute degree ended and now we could either be seeing the uptrend continuation in a form of another impulse wave or the second wave out of the higher degree three-wave correction.
Since the five-wave impulse from 10th looks like it ended now we are likely to see downside movement which could be only a minor one before further uptrend continuation or the start of the expected downturn alltogether.
FXOpen offers the world's most popular cryptocurrency CFDs*, including Bitcoin and Ethereum. Floating spreads, 1:2 leverage — at your service (additional fees may apply). Open your trading account now or learn more about crypto CFD trading with FXOpen.
*Important: At FXOpen UK, Cryptocurrency trading via CFDs is only available to our Professional clients. They are not available for trading by Retail clients. To find out more information about how this may affect you, please get in touch with our team.
This article represents the opinion of the Companies operating under the FXOpen brand only. It is not to be construed as an offer, solicitation, or recommendation with respect to products and services provided by the Companies operating under the FXOpen brand, nor is it to be considered financial advice.
Stay ahead of the market!
Subscribe now to our mailing list and receive the latest market news and insights delivered directly to your inbox.


Latest articles

Apple: Earnings Day Above the Activity Zone
On 30 April, after the market close, Apple Inc. will release its financial results for the second quarter of fiscal 2026. The consensus forecast, based on estimates from 31 analysts, points to revenue of around $109.7 billion, with expected

USD/JPY and USD/CHF Near Key Levels: The Dollar Supported by the Fed
The US dollar continues to trend upwards following the Federal Reserve meeting, drawing support from the regulator’s moderately hawkish stance and comments by Jerome Powell. Markets interpret the Fed’s rhetoric as a signal that restrictive policy is likely

EUR/USD and GBP/USD consolidate ahead of the Fed decision
European currencies are showing subdued dynamics, entering a consolidation phase following their previous advance. Earlier, EUR/USD and GBP/USD broke out of their ranges and strengthened; however, the subsequent correction has led both pairs to retest the previously breached