


BTCUSD and XRPUSD Technical Analysis – 05th JULY 2022
FXOpen

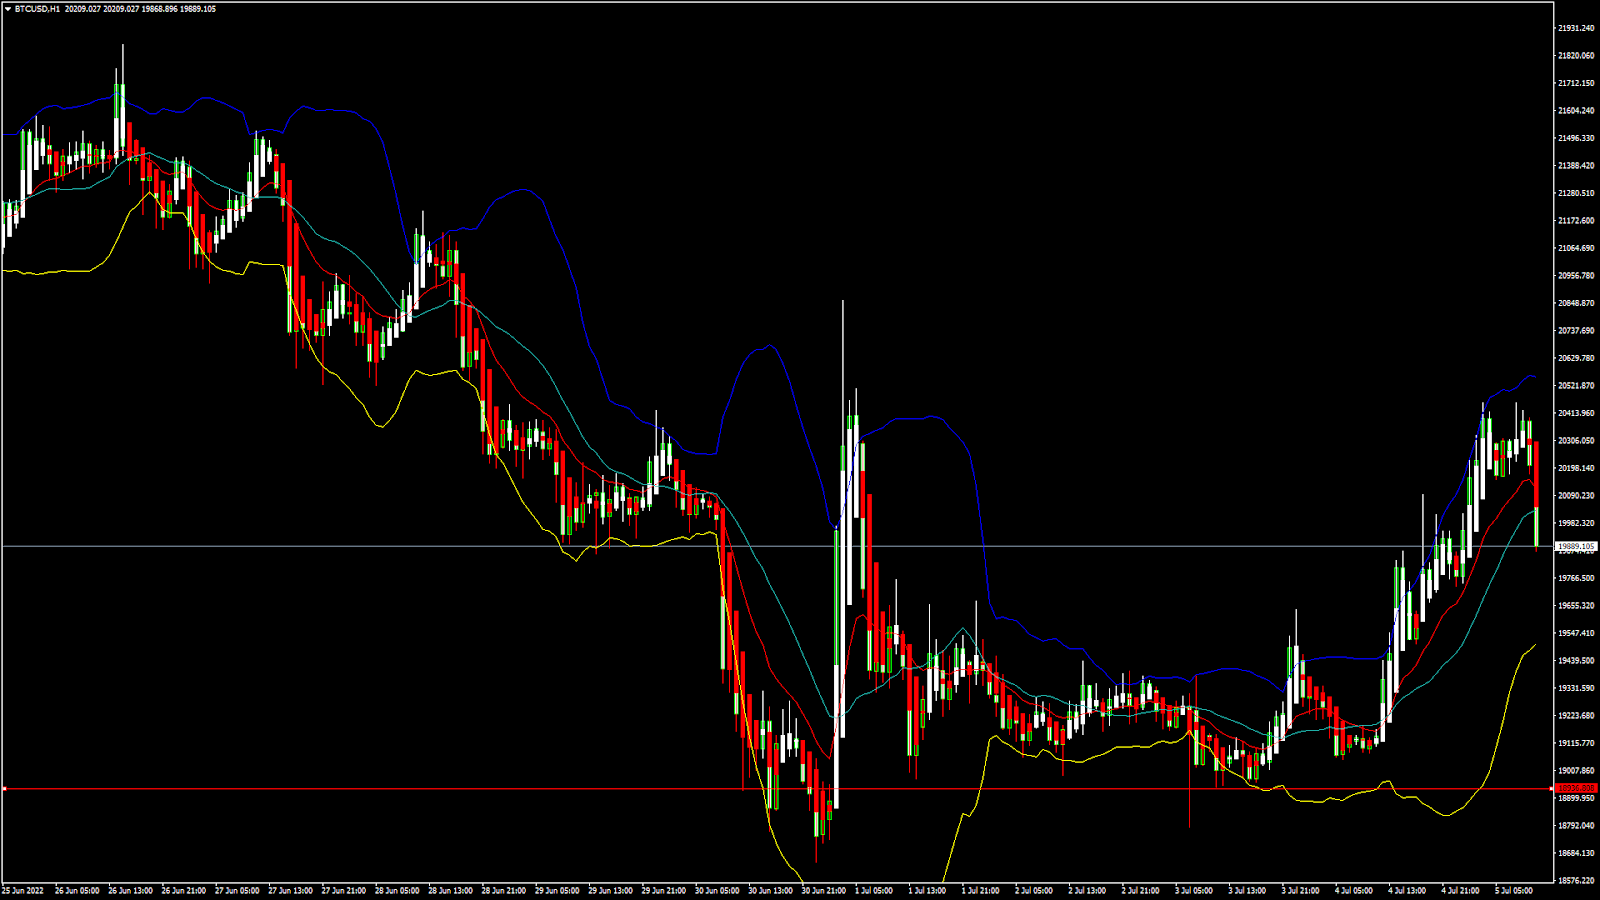
BTCUSD: Bullish Doji Star Pattern Above $18900
Bitcoin was unable to sustain its bullish momentum last week and started to decline against the US dollar touching a low of 18646 on 30th June, after which we can see some correction in its levels above the $19000 handle.
The prices of bitcoin started to reverse, confirming the bullish tone in the markets. We can see a shift towards the consolidation channel above the $19500 handle in the European trading session today.
We can clearly see a bullish doji star pattern above the $18900 handle which is a bullish reversal pattern because it signifies the end of a downtrend and a shift towards an uptrend.
Both the STOCH and STOCHRSI are indicating overbought levels which means that in the immediate short term a decline in the prices is expected.
The relative strength index is at 56 indicating a STRONG demand for bitcoin at the current market levels.
Bitcoin is now moving below its 100 hourly simple moving average and its 200 hourly simple moving average.
All of the major technical indicators are giving a strong buy signal, which means that in the immediate short term, we are expecting targets of 20500 and 22000.
The average true range is indicating less market volatility with a bullish momentum.
- Bitcoin: bullish reversal seen above $18900
- The Williams percent range is indicating an overbought level
- The price is now trading just below its pivot level of $20266
- Some of the moving averages are giving a buy market signal
Bitcoin: Bullish Reversal Seen Above $18900
The price of Bitcoin has entered into a consolidation channel above the $19000 handle and the continuation of the bullish momentum above the $19500 level.
The global sentiments continue to improve, and now the prices are forming an ascending channel above the $19000 level.
A bullish run is expected up to the level of $24821 as indicated by the simple MA 200, after which we will see some downwards correction.
The on-chain activity has increased which points to a potential bullish nature of the prevailing market conditions.
The immediate short-term outlook for bitcoin is Bullish; the medium-term outlook has turned neutral; and the long-term outlook remains neutral under present market conditions.
Bitcoin is finding support above the $18500 level as the prices continue to remain above these levels during the bearish phase of the markets.
The price of BTCUSD is now facing its classic resistance level of 20365 and Fibonacci resistance level of 20527 after which the path towards 21000 will get cleared.
In the last 24hrs, BTCUSD has increased by 3.89% by 745$ and has a 24hr trading volume of USD 24.759 billion. We can see an increase of 61.73% in the trading volume as compared to yesterday, which is due to the buying seen at lower levels by the medium-term Investors.
The Week Ahead
The price of bitcoin is moving in a bullish momentum, and the immediate targets are $20500 and $21500. The daily RSI is printing at 35 which means that the medium range demand continues to be weak.
We can see that the prices of bitcoin have stabilized above the $19000 handle, and now we are looking at the important support levels of $18847 and $19150.
The price of BTCUSD will need to remain above the important support level of $19000 this week.
The weekly outlook is projected at $22500 with a consolidation zone of $20500.
Technical Indicators:
The average directional change (14 days): at 33.00 indicating a BUY
The ultimate oscillator: at 51.57 indicating a BUY
The rate of price change: at 3.075 indicating a BUY
The commodity channel index (14 days): at 92.63 indicating a BUY
XRPUSD: Bullish Hammer Pattern Above 0.3085
Ripple was unable to continue its bullish momentum last week and started to decline against the US Dollar touching a low of 0.3059 on 30th June, after which we can see a move towards the consolidation channel above the level of 0.3100.
We can see that prices have crossed the 10-day and 20-day moving averages in the 5-hour timeframe indicating that the trend is upwards.
We saw that the prices of Ripple continue to remain above the 0.3200 handle in the European trading session today.
We can clearly see a bullish hammer pattern above the 0.3085 handle which is a bullish reversal pattern and signifies an uptrend.
The short-term outlook for Ripple has turned bullish; the medium-term outlook is neutral; and the long-term outlook is neutral under present market conditions.
The relative strength index is at 49 which signifies a neutral demand for Ripple at the current market prices and the continuation of the consolidation channel this week.
Some of the moving averages are giving a buy signal at the current market level of 0.3222.
Ripple is now trading below its pivot level of 0.3269 and is now facing its classic resistance level of 0.3286 and Fibonacci resistance level of 0.3311 after which the path towards 0.3500 will get cleared.
Most of the major technical indicators are giving a strong buy signal.
- Ripple: bullish reversal seen above the 0.3085 level
- The average directional change is indicating a neutral level
- The average true range indicates lesser market volatility
- Some of the technical indicators are giving a neutral market signal
Ripple: Bullish Reversal Seen Above 0.3085

We can see that the prices of Ripple have entered into a consolidation channel above the 0.3100 handle in the European trading session today.
The price of Ripple is forming an ascending triangulation pattern confirming a potential bullish nature of the underlying market forces.
Ripple is expected to recover its losses and maintain a bullish tone this week and the bullish trend reversal is expected to push its prices above the $0.5000 level.
We can see that moving averages MA5 and MA50 are indicating a sell-off in the markets in the 5-hour time frame.
We can see that XRP touched a low of 0.3209 in the European trading session and an intraday high of 0.3303 in the Asian trading session today.
The price of XRPUSD has increased by 1.89% with a price change of $0.005985 in the past 24hrs and has a trading volume of 1.075 Billion USD.
We can see an increase of 26.70 in the trading volumes of Ripple as compared to yesterday, which is due to the buying seen by the medium-term investors.
This Week Ahead
The prices of XRPUSD are now moving into a consolidation channel above the 0.3200 handle and the next visible targets are 0.3300 and 0.3500.
We can see the continuation of the bullish trendline from last week, and the prices continue to remain above the important support level of 0.3000.
Next week, Ripple is expected to enter into a fresh wave of buying above the 0.3200 handle.
The weekly outlook for Ripple is projected at 0.3500 with a consolidation zone of 0.3300.
Technical Indicators:
The commodity channel index: at 60.13 indicating a BUY
STOCHRSI (14 days): at 73.51 indicating a BUY
The rate of price change: at 2.67 indicating a BUY
The Williams percent range: at -40.48 indicating a BUY
FXOpen offers the world's most popular cryptocurrency CFDs*, including Bitcoin and Ethereum. Floating spreads, 1:2 leverage — at your service (additional fees may apply). Open your trading account now or learn more about crypto CFD trading with FXOpen.
*Important: At FXOpen UK, Cryptocurrency trading via CFDs is only available to our Professional clients. They are not available for trading by Retail clients. To find out more information about how this may affect you, please get in touch with our team.
This article represents the opinion of the Companies operating under the FXOpen brand only. It is not to be construed as an offer, solicitation, or recommendation with respect to products and services provided by the Companies operating under the FXOpen brand, nor is it to be considered financial advice.
Stay ahead of the market!
Subscribe now to our mailing list and receive the latest market news and insights delivered directly to your inbox.


Latest articles

GBP/USD and EUR/GBP Await Key Bank of England Decision
The pound strengthened following the outcome of the US Federal Reserve meeting, where the central bank, as expected, kept interest rates unchanged. However, the Fed did not provide the market with clear signals of an imminent shift towards rate cuts,

Microsoft Analysis: Earnings Beat Expectations
On 29 July 2026, Microsoft reported its results for the fourth quarter of fiscal year 2026. Revenue reached $90 billion, up 18% year-on-year, while adjusted earnings per share came in at $4.74, comfortably ahead of analysts' expectations of $4.

EUR/USD: All Eyes on the Fed as the Range Reaches Its Breaking Point
The dollar's next move hinges on tonight's Fed decision, and this time markets genuinely don't know what to expect. While economists still lean toward a hold—with CME FedWatch odds sitting near 68.5% for no change—Kevin Warsh's hawkish