


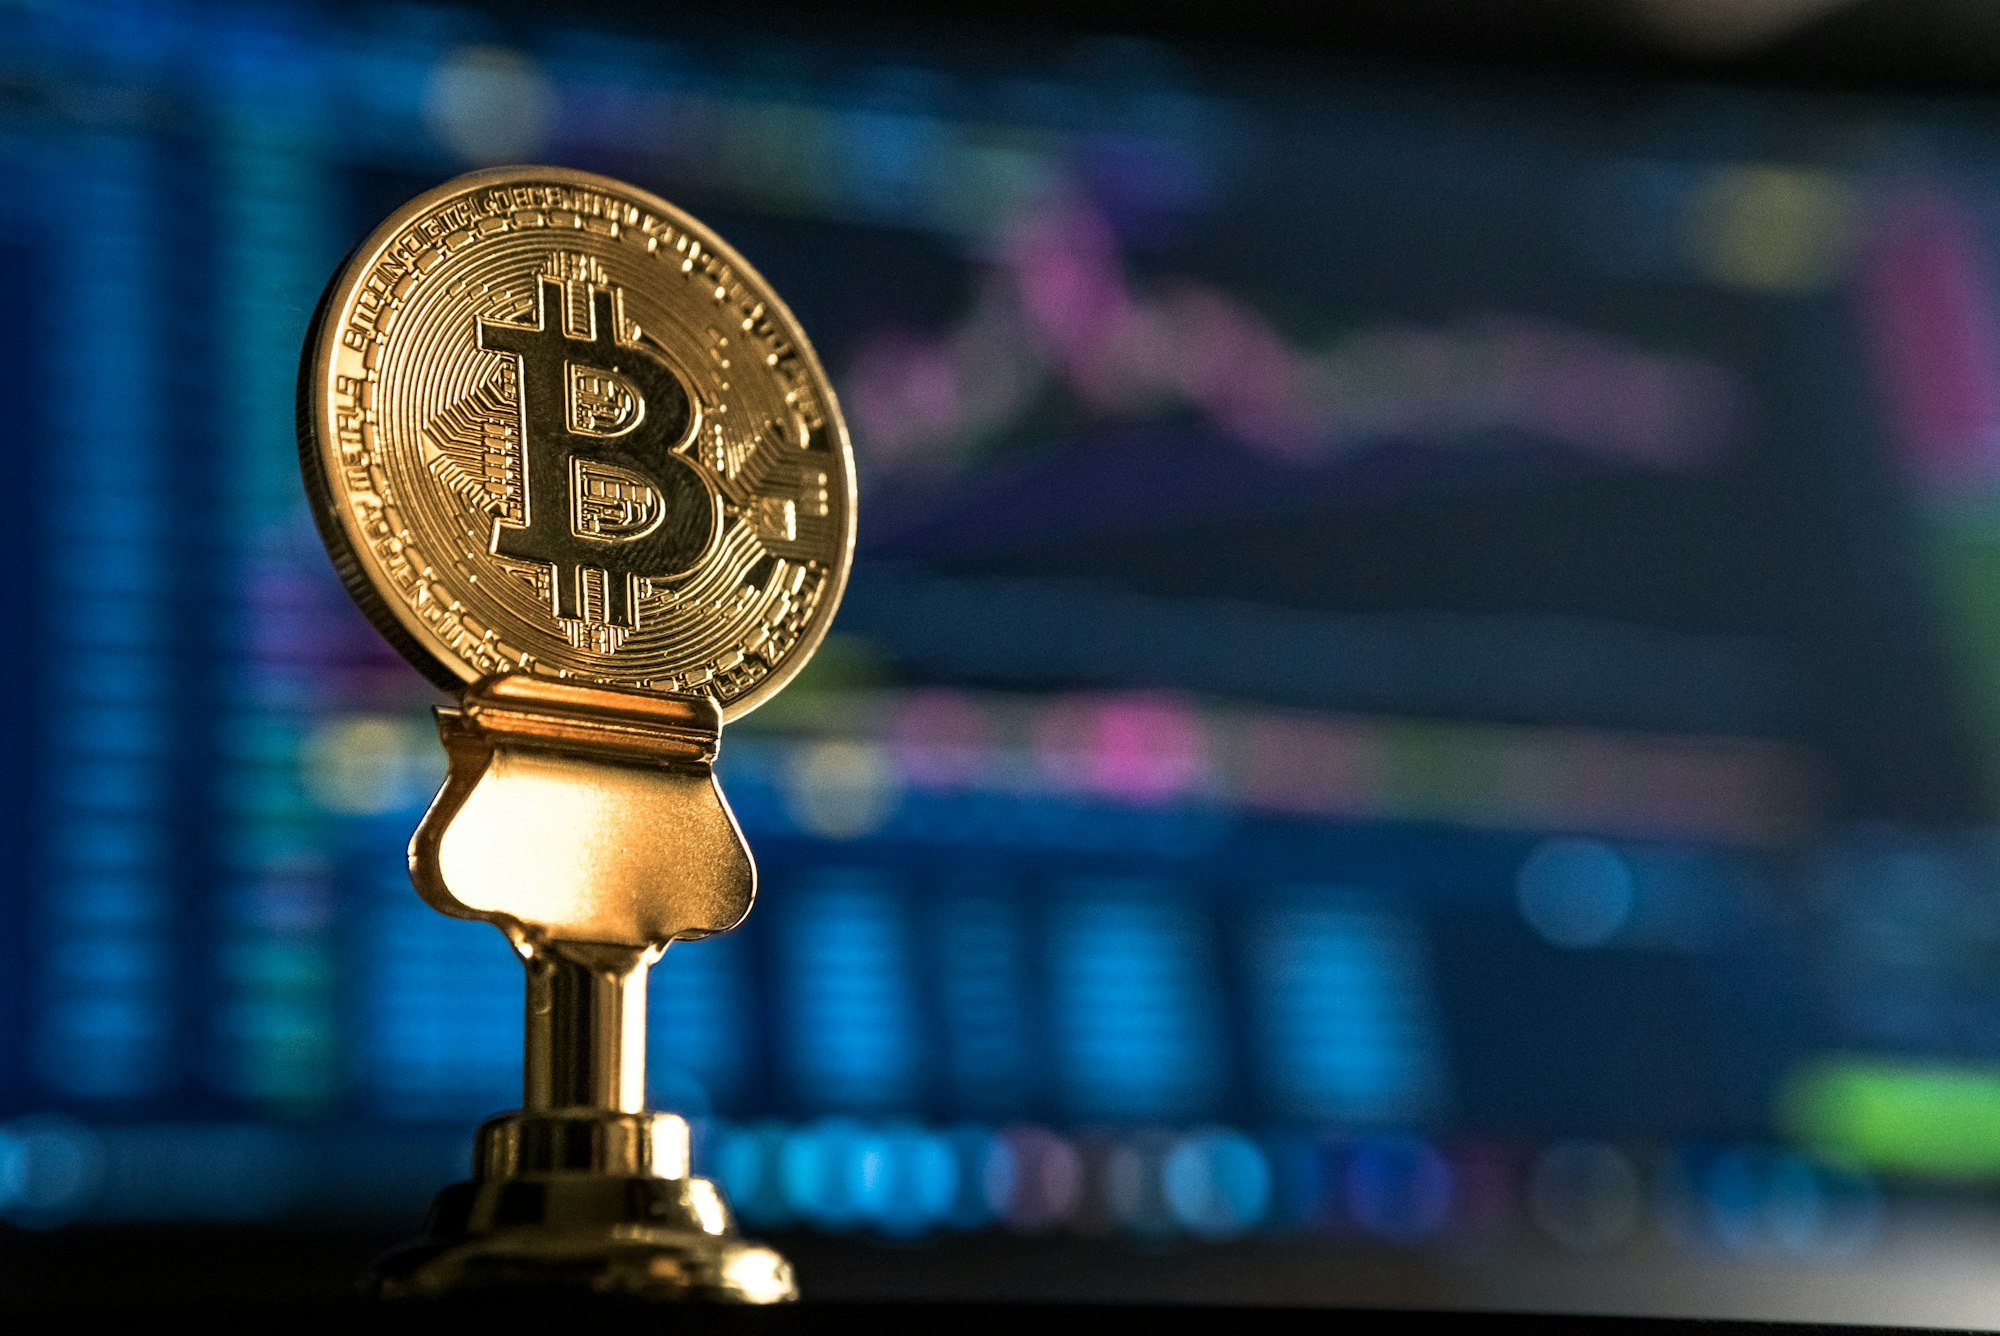
BTCUSD and XRPUSD Technical Analysis – 07th DEC, 2021
FXOpen
BTCUSD: Rounding Bottom Pattern Above $46,000
Bitcoin suffered heavy losses on Dec 4th, which was primarily driven by liquidation of the holdings from the long-term investors in the markets.
Additionally, the Dec 4th bitcoin plunge occurred due to the Omicron coronavirus variant which saw BTC touching a low of $45,000.
We saw BTCUSD touch a high of $59,157 on 30th Nov, and form a bullish momentum before entering a consolidation channel above $55,000.
Today, bitcoin is back in the bullish channel and trading above the $50,000 handle in the European trading session.
We can clearly see a rounding bottom pattern above the $46,000 handle which signifies that the markets have entered into a bullish uptrend.
In the US Trading session, bitcoin is trading in a consolidation phase and is expected to continue doing so.
The short-term outlook for bitcoin has turned MILDLY BULLISH.
Both the Stoch and StochRSI are indicating an OVERBOUGHT level, which means that in the immediate short-term, a decline in the price is expected.
Bitcoin is now moving above its 100 hourly simple and exponential moving averages.
The average true range is indicating lesser market volatility which means that markets will enter a consolidation phase soon.
- Bitcoin trend reversal is seen above $46,000
- Stoch is indicating an OVERBOUGHT level
- The price is now trading just below its pivot level of $51,140
- All the moving averages are giving a BUY signal at current market level of $51,027
Bitcoin: Trend Reversal Towards $60,000 Confirmed

BTCUSD has already recovered its losses from last week and is now trading above the important psychological support level of $50,000.
We will need to see a confirmation of the uptrend once the prices hit the $52,000 handle some time later today.
Some of the major technical indicators are giving a STRONG SELL signal, which means that the prices can also get a downward correction before reaching the level of $60,000.
The price of BTCUSD is trading below its classic resistance level of $51,345 and Fibonacci resistance level of $51,478 in the European trading session.
In the last 24hrs, BTCUSD has gone UP by 6.62% with a price change of $3,170 and a 24hr trading volume of USD 37.942 billion. We can see an increase of 12.54% in trading volume as compared to yesterday.
The Week Ahead
We can see that bitcoin has recovered from last week’s losses and is on its way towards reaching the $58,000 handle this week.
The medium to long-term outlook remains BULLISH for bitcoin with the target of $62,000. At present, the markets are giving a BUY signal, so it would be best to enter long positions in bitcoin.
The relative strength index of 65 is indicating a BULLISH channel, and fresh buying is expected in the markets at any time.
We can see that the fears related to Omicron are vanishing, and new investors are coming back to the markets which also explains the increased market volatility today.
Technical Indicators:
Stoch (9,6): at 99.04 indicating an OVERBOUGHT level
Average directional change (14-day): at 50.66 indicating a BUY
Rate of price change: at 4.047 indicating a BUY
Moving averages convergence divergence (12,26): at 553.80 indicating a BUY
XRPUSD: Rounding Bottom Pattern Above 0.7200
Last week, we saw Ripple crashing and briefly touching a low of 0.5964 — a flash crash that occurred due to the emergence of the Omicron coronavirus variant. Last week’s 8% drop also happened due to long-term liquidations observed across crypto markets.
The markets have recovered from their losses, and in today’s European trading session, the prices are ranging above the 0.8300 handle.
We can clearly see a rounding bottom pattern above the 0.7200 handle which signifies a shift towards an uptrend and a continuation of the bullish channel.
In today’s Asian trading session, Ripple touched an intraday high of 0.8454, and the prices are now ranging into a consolidation phase above 0.8000.
The relative strength index is giving a BUY signal, meaning that the markets are due to enter a fresh rally once the consolidation phase is over.
The short-term outlook for Ripple is BULLISH, medium-term outlook appears strongly bullish, and the long-term outlook is bullish.
Ripple is now trading just below its pivot level of 0.8367, remaining above its classic support level of 0.8219 and Camarilla support level of 0.8370 in the European trading session.
- All technical indicators are giving a STRONG BUY signal
- Ripple has entered into a BULLISH channel above the 0.7200 level
- All the moving averages are giving a BUY signal
- Average true range indicates LESS market volatility
Ripple: Bullish Trend Reversal Towards 0.9000 Confirmed

Ripple has recovered from last week’s heavy losses, but the prices still remain below the important psychological support levels of 1.0000.
The market volatility is LESS today which means the market has entered the consolidation phase.
The technical indicators and moving averages are giving a BUY signal, meaning that the prices of Ripple are due to enter into an upwards correction in today’s US trading session.
In the past 24hrs, the price of XRPUSD has gone UP by 7.27% with a price change of $0.05646 and has a trading volume of 3.329 billion USD.
We have seen a 1.55% decrease in Ripple’s trading volumes in the last 24 hours.
This Week Ahead
The price of XRPUSD is trading just below its pivot level of 0.8367 in the European trading session. Ripple would need to clear its classic resistance level of 0.8548 and Fibonacci resistance level of 0.8477 which will open its path towards the 0.9000 handle.
This is the best opportunity for long-term traders to enter into a long position in the markets with a target of $1.2500 in January 2022.
Since Jan 1s 2021, Ripple price has gained 351% to reach its present value of 0.8346 over the year.
Technical Indicators:
Commodity channel index (14-day): at 78.62 indicating BUY
Average directional change (14-day): at 57.87 indicating BUY
Relative strength index (14-day): at 62.59 indicating a BUY
Bull/Bear power (13-day): at 0.0283 indicating a BUY
FXOpen offers the world's most popular cryptocurrency CFDs*, including Bitcoin and Ethereum. Floating spreads, 1:2 leverage — at your service (additional fees may apply). Open your trading account now or learn more about crypto CFD trading with FXOpen.
*Important: At FXOpen UK, Cryptocurrency trading via CFDs is only available to our Professional clients. They are not available for trading by Retail clients. To find out more information about how this may affect you, please get in touch with our team.
This article represents the opinion of the Companies operating under the FXOpen brand only. It is not to be construed as an offer, solicitation, or recommendation with respect to products and services provided by the Companies operating under the FXOpen brand, nor is it to be considered financial advice.
Stay ahead of the market!
Subscribe now to our mailing list and receive the latest market news and insights delivered directly to your inbox.


Latest articles

AUD/USD: Will the RBA Be Able to Keep Its Currency Strong?
As the chart shows, AUD/USD has entered a distinctly bearish phase in recent weeks, reflecting the broader consolidation — and in some cases outright weakness — that the US dollar has begun imposing across most major currency pairs.
Fundamental Analysis
The
AUD/CAD: Pair Remains Range-Bound Amid Interest Rate Divergence
The key macroeconomic factor for AUD/CAD remains the divergence in monetary policy between the two central banks. After three consecutive rate hikes since the beginning of the year, the Reserve Bank of Australia left its cash rate unchanged at

Brent Crude Oil Analysis: Stabilisation or Simply a Pause?
Over the past few weeks, financial markets have been more focused than ever on developments surrounding the Strait of Hormuz — a critical waterway at the centre of ongoing US-Iran negotiations. The back-and-forth of diplomatic headlines has injected significant volatility into