


BTCUSD and XRPUSD Technical Analysis – 07th MAR 2023
FXOpen

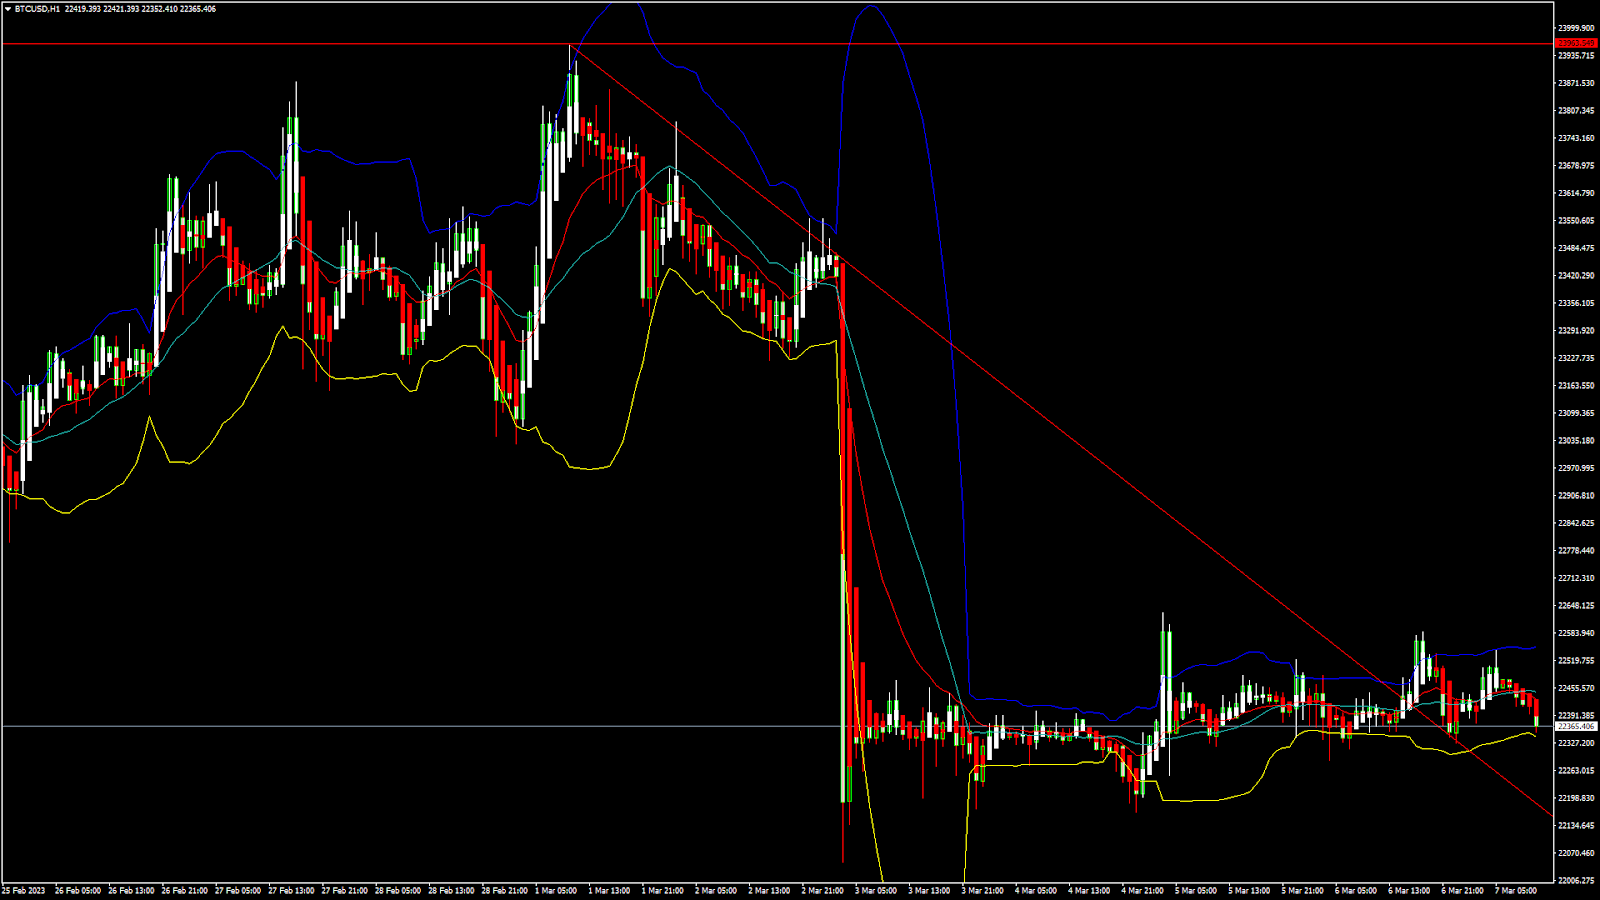
BTCUSD: Evening Star Pattern Below $23963
Bitcoin was unable to sustain its bullish momentum last week and after touching a high of $23963 on 01st March, the prices started to correct downwards against the US dollar, touching a low of $22048 on 03rd March.
We have seen a bearish opening of the markets this week.
We can clearly see an evening star pattern below the $23963 handle which is a bearish reversal pattern because it signifies the end of an uptrend and a shift towards a downtrend.
Bitcoin touched an intraday high of 22544 in the Asian trading session, and an intraday low of 23370 in the European trading session today.
The momentum indicator is back under zero in the 4-hour time frame indicating bearish trends.
The price of bitcoin is ranging near a new record low of 1 month.
Both the STOCH and Williams percent range are indicating overbought levels which means that in the immediate short term, a decline in the prices is expected.
We can see the formation of bearish engulfing lines in the 1-hour time frame.
The relative strength index is at 43.75 indicating a weak demand for bitcoin, and the continuation of the selling pressure in the markets.
Bitcoin is now moving below its 100 hourly simple moving average and below its 100 hourly exponential moving averages.
Most of the major technical indicators are giving a sell signal, which means that in the immediate short term, we are expecting targets of 22000 and 21500.
The average true range is indicating less market volatility with a bearish momentum.
- Bitcoin: bearish reversal seen below $23963.
- The STOCHRSI is indicating an oversold market.
- The price is now trading just below its pivot level of $22414.
- The short-term range is mildly bearish.
Bitcoin: Bearish Reversal Seen Below $23963
The price of bitcoin is now moving in a consolidation channel above the $22000 handle after which fresh declines could be expected, or we can see some market correction upwards if the demand for bitcoin increases in the global markets.
Some of the technical indicators are also giving a neutral tone present in the markets.
We can see the formation of a bearish price crossover pattern with the adaptive moving average, AMA 50, in the 30-minute time frame.
The price of bitcoin is ranging near the resistance of the channel indicating a bearish trend present in the markets.
The immediate short-term outlook for bitcoin is strongly bearish, the medium-term outlook has turned bearish, and the long-term outlook remains neutral under present market conditions.
Bitcoin’s support zone is located at $21780 which is a 3-10 day MACD oscillator stalls, and at $21851 at which the price crosses 18-day moving average stalls.
The price of BTCUSD is now facing its classic support level of 22376 and Fibonacci support level of 22404 after which the path towards 22000 will get cleared.
In the last 24hrs, BTCUSD has increased by 0.03% by 5.75$ and has a 24hr trading volume of USD 15.799 billion. We can see an increase of 1208% in the trading volume compared to yesterday, which appears to be normal.
The Week Ahead
We can see that the price of Bitcoin has resumed its downtrend, which may extend to $21500 after which we may see some correction and change in the trend present in the markets.
There is a descending channel forming with the current support located at $20785 which is a 50% retracement from a 13-week high/low.
The daily RSI is printing at 43.26 which indicates a weak demand for bitcoin and the continuation of the bearish phase present in the markets in the short-term range.
We can see the formation of a bearish trendline from $23963 towards the $22141 level.
The price of BTCUSD is now facing its resistance zone located at $22695 which is a 14-3 day raw stochastic at 20% and at $22774 which is a 14-day RSI at 50%
The weekly outlook is projected at $21500 with a consolidation zone of $22000.
XRPUSD: Bearish Engulfing Pattern Below $0.3845
Ripple was unable to sustain its bullish momentum last week and after touching a high of $0.3845 on 01st March, the prices started to correct downwards against the US dollar touching a low of $0.3600 on 06th March.
We have seen a bearish opening of the markets this week.
We can clearly see a bearish engulfing pattern below the $0.3845 handle which is a bearish reversal pattern because it signifies the end of an uptrend and a shift towards a downtrend.
Ripple touched an intraday low of 0.3670 and an intraday high of 0.3726 in the Asian trading session today.
The price of Ripple is ranging near a new record low of 1 month.
The relative strength index is at 49.54 which signifies a neutral demand for Ripple at the current market prices and the continuation of the bearish phase in the markets.
Most of the moving averages are giving a sell signal at the current market levels of 0.3702.
The STOCHRSI is indicating an oversold level, which means that the price is expected to correct upwards in the short-term phase.
Ripple is now trading just above its pivot level of 0.3691 and is now facing its classic support level of 0.3672 and Fibonacci support level of 0.3686 after which the path towards 0.3600 will get cleared.
Most of the major technical indicators are giving a sell signal.
- Ripple: bearish reversal seen below the 0.3845 level.
- The STOCHRSI is indicating an oversold market.
- The average true range indicates less volatility.
- Ripple gains bearish bias against the US dollar.
Ripple: Bearish Reversal Seen Below $0.3845

We can see that Ripple has resumed its downtrend and now we are looking to touch $0.3600 level before any trend reversal could be seen in the markets.
We can see the formation of the bearish Harami pattern in the daily time frame.
The price of Ripple is back under the pivot point in the 4-hour time frame indicating bearish trends.
We have also detected the formation of the bearish Harami cross pattern in the 30-minute time frame.
The Ichimoku price is under the cloud in the 15-minute time frame indicating the bearish nature of the markets.
The RSI Indicator is back under 50 in the 1-hour time frame indicating bearish trends.
The short-term outlook for Ripple has turned bearish, the medium-term outlook is neutral, and the long-term outlook is neutral under present market conditions.
The price of XRPUSD has increased by 1.80% with a price change of $0.006551 in the past 24hrs and has a trading volume of 1.104 billion USD.
We can see an increase of 25.41% in the trading volumes of Ripple compared to yesterday, which is due to the market consolidation seen this week.
This Week Ahead
Ripple is now moving in a zigzag pattern after the recent decline, and the prices are ranging in a consolidation zone above the $0.3650 handle.
Some of the technical indicators are also giving a neutral tone present in the markets.
We are now looking for fresh decline below the $0.3600 levels and any signs of a bullish recovery will be visible once the prices touch these levels.
We can see a continuous progression of a bearish trend line formation from $0.3845 towards the $0.3531 level.
The support zone is located at $0.3604 which is a 38.2% retracement from a 13-week low, and at $0.3620 which is a pivot point 1st support point.
The weekly outlook for Ripple is projected at $0.3600 with a consolidation zone of $0.3700.
FXOpen offers the world's most popular cryptocurrency CFDs*, including Bitcoin and Ethereum. Floating spreads, 1:2 leverage — at your service (additional fees may apply). Open your trading account now or learn more about crypto CFD trading with FXOpen.
*Important: At FXOpen UK, Cryptocurrency trading via CFDs is only available to our Professional clients. They are not available for trading by Retail clients. To find out more information about how this may affect you, please get in touch with our team.
This article represents the opinion of the Companies operating under the FXOpen brand only. It is not to be construed as an offer, solicitation, or recommendation with respect to products and services provided by the Companies operating under the FXOpen brand, nor is it to be considered financial advice.
Stay ahead of the market!
Subscribe now to our mailing list and receive the latest market news and insights delivered directly to your inbox.


Latest articles

Weekly Market Insights with Gary Thomson: The Week of Central Banks and Earnings
In this video, we’ll explore the key economic events and market trends, shaping the financial landscape. Get ready for insights into financial markets to help you navigate the week ahead. Let’s dive in!
In this episode of Market

Intel at a Crossroads: Earnings Beat Meets Technical Resistance
Intel has just delivered its strongest quarter in over fifteen years, and the market reaction says it all. Q2 2026 revenue surged 25% year-over-year to $16.1 billion, crushing the consensus estimate of $14.42 billion, while adjusted EPS of

Tesla: Complex Range Structure Breaks Down Following Quarterly Earnings
Tesla released its Q2 2026 results after the market closed on 22 July. Revenue increased 26% year-on-year to $28.24 billion, while vehicle deliveries reached a record 480,126 units. However, operating margin fell sharply to 1.4%, down from