


BTCUSD and XRPUSD Technical Analysis – 12th OCT, 2021
FXOpen

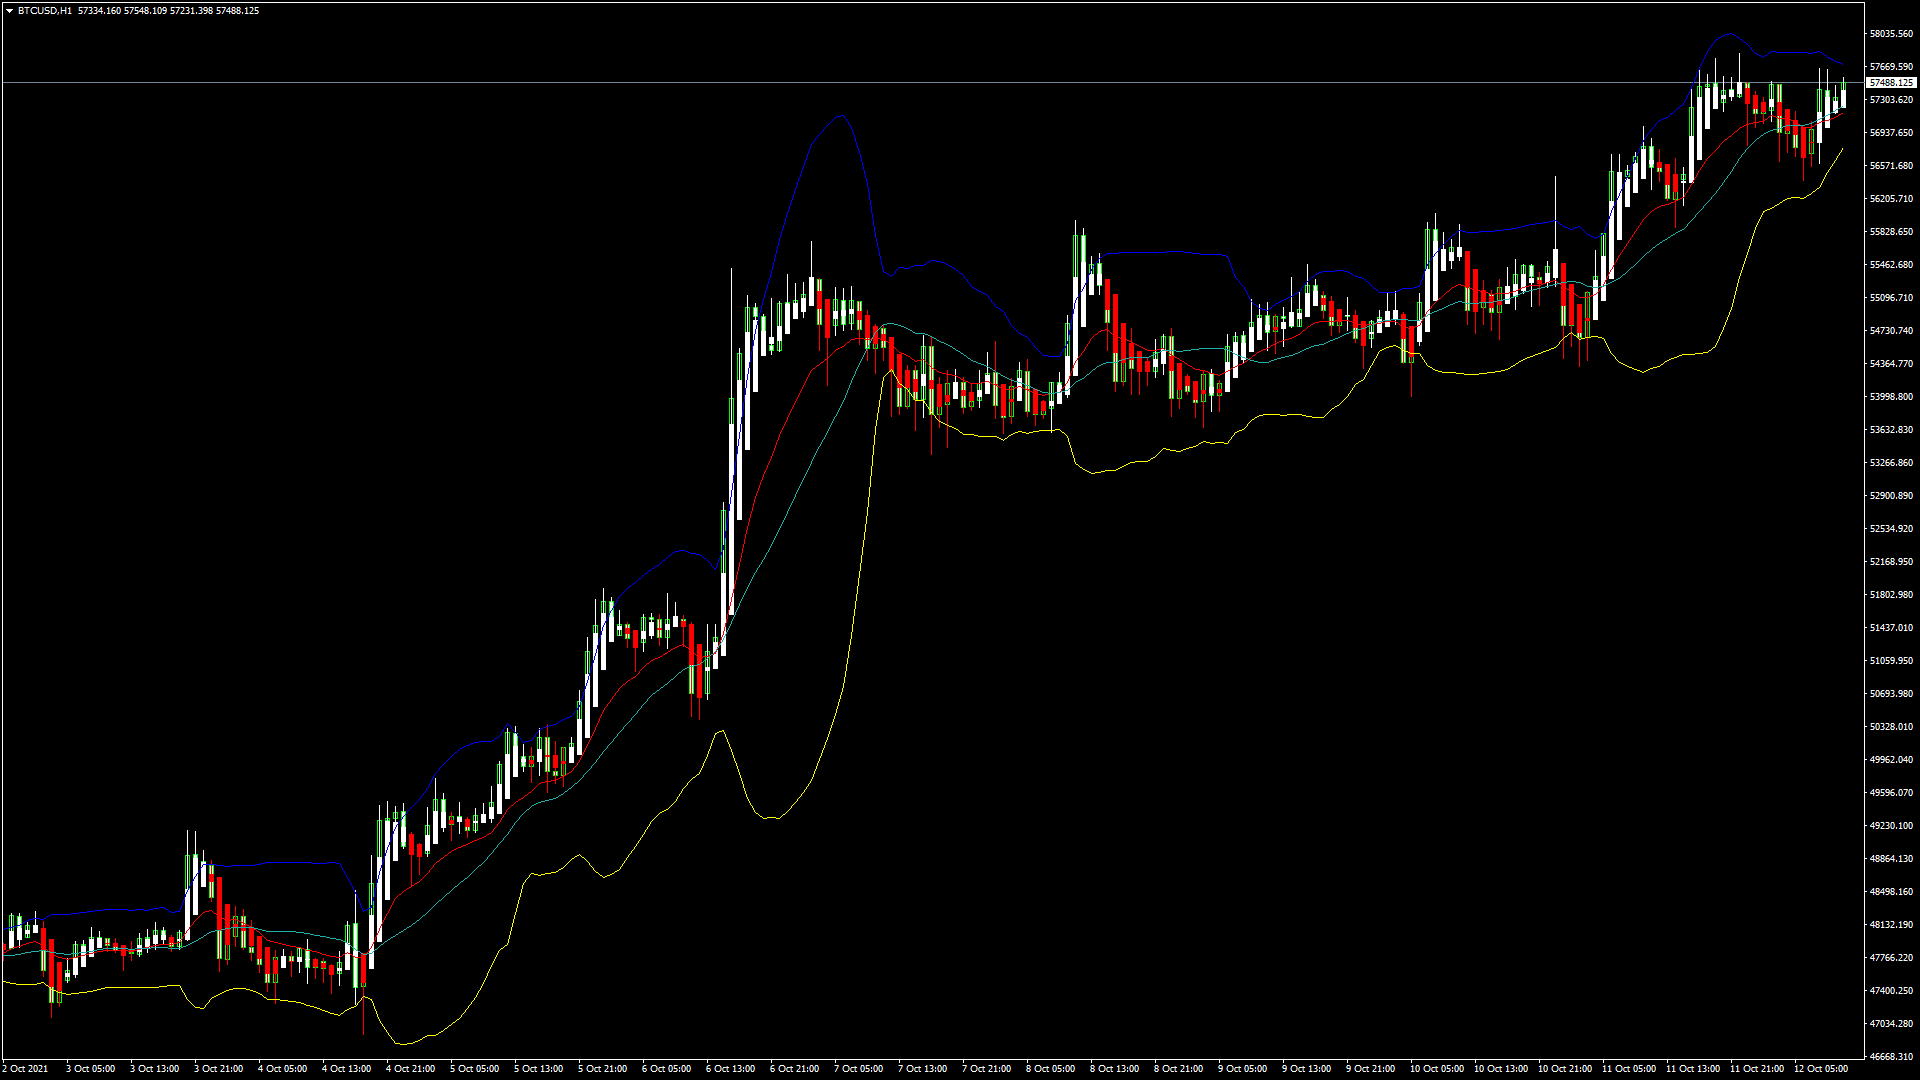
BTCUSD: Rising Uptrend Channel Above $54K
Bitcoin continues to gain momentum and is now moving in a rising uptrend channel formation above $54000. BTCUSD continues its bullish run today in the European trading session, having crossed the level of $57000. Bitcoin is trading above both 100 hourly simple and exponential moving averages. The rally in the BTC continues with fresh buying support seen after it touched an intraday low of $56439 today in the Asian trading session.
The medium to long term outlook for bitcoin remains bullish with immediate targets for today at $58500.
Commodity channel index (14-day) and ultimate oscillator are both indicating a BUY at the current market levels of $57450.
- Bitcoin crossed its major resistance levels of $51357 and continues to remain above these levels.
- BTCUSD short-term correction is expected towards $56000 today in the US trading session.
- The price is now trading above its pivot levels of $57314.
- A high relative strength (RSI) of 58.60 is a sign of overbought levels.
Bitcoin’s Rally Towards $60K Confirmed
BTCUSD price may also get into a consolidation phase below $57000 today in the US trading session. Bitcoin dips are well supported this week and the price remains above its classic support levels of $56454 and Fibonacci support levels of $56773. Now the price of bitcoin needs to clear the Woodie’s resistance level of $58029 after which the path towards $62000 will get cleared.
In the last 24hrs BTCUSD is up by +1.43% at +1057$ and has a 24hr trading volume of USD 40.167 billion.
Bitcoin Gaining Traction
There has been an increased demand for bitcoin from Central and Latin America after the adoption of bitcoin as legal tender by El Salvador. The increase in the number of peer to peer (P2P) transactions seen in both Central and Latin America is fueling the demand for bitcoin and its wide scale adoption and usage.
Bitcoin dips remain well supported with increased buying pressure seen above $54000. The demand for bitcoin remains at an all-time high on major cryptocurrency exchanges worldwide.
The Week Ahead
The price of BTCUSD is moving between the support level of $52000 and its major resistance level of $63500. Now, if the bull run continues, we will see BTCUSD printing at above $60000, but if the bearish correction starts, the prices will go down towards the $55000 handle.
Since the medium-term outlook remains bullish, we will see BTCUSD closing above $60000 this week and crossing the levels of $62000 in the opening of next week.
Technical Indicators:
Relative strength index (14-day): at 58.60 indicating a BUY
Bull/Bear power (13-day): at 419.85 indicating a BUY
Moving averages convergence divergence (12,26): at 248.30 indicating a BUY
StochRSI (9,6): at 98.69 indicating overbought levels.
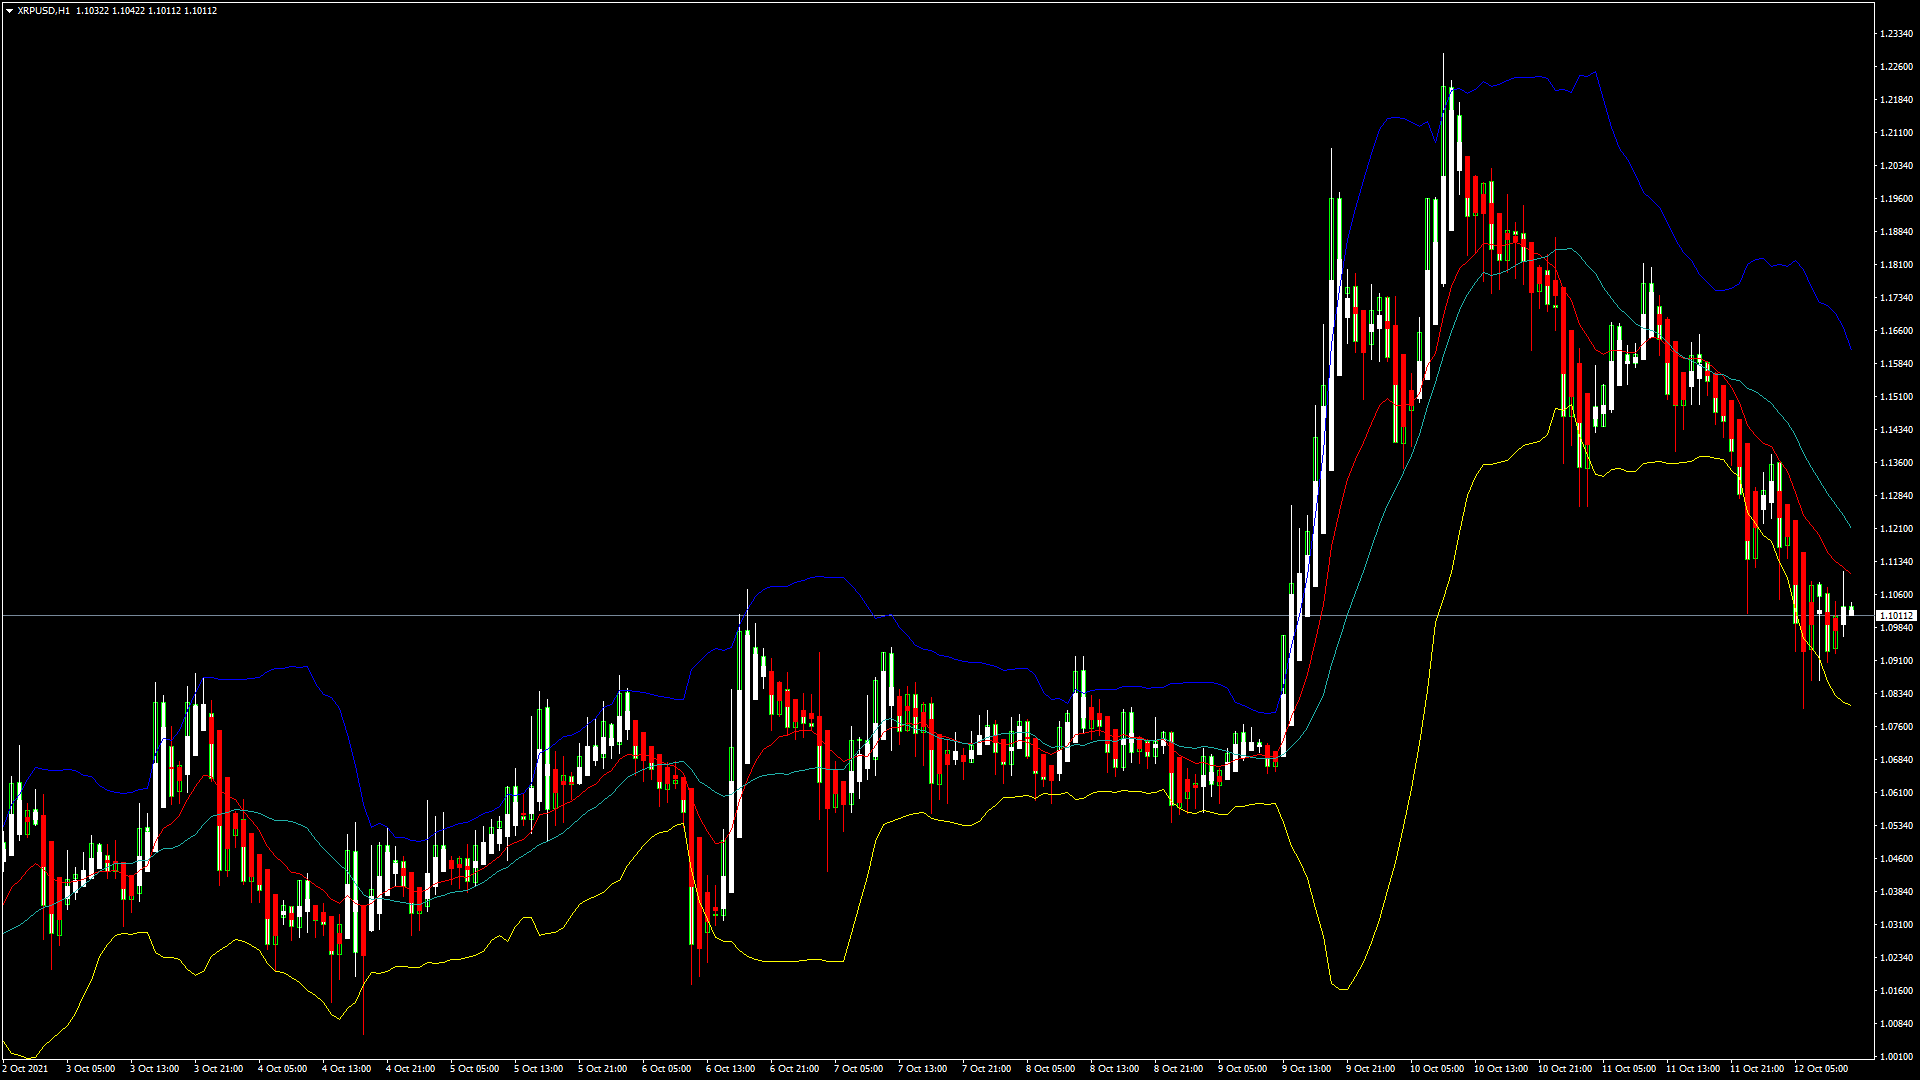
XRPUSD: Bearish Correction Towards $1.0500
Ripple is currently trading below both the 100 hourly simple and exponential moving averages. Today, the price of XRPUSD is moving in a bearish correction phase towards the $1.0500 handle in the European trading session.
This week, Ripple touched an intraday high of 1.2290 after which the bearish trend started and the price is now moving below $1.11 handle. All the major technical indicators are giving a SELL signal. Today, the price is expected to decline further below the Fibonacci support levels of 1.09552, and its classic support levels of 1.08368.
- Ripple is indicating a bearish momentum with the commodity channel index of 14 days
- Continuous selling pressure is seen above 1.1500 levels
- Average true range (14-day) is indicating high market volatility
- Rate of change indicator is giving a SELL signal at current market levels of 1.0962
Ripple Continues Bearish Decline
The price of Ripple is moving in a corrective bearish channel today and the prices are expected to decline further down in the US trading session.
XRPUSD is down by -6.49% with a price change of -$0.07544 in the past 24hrs, and has a trading volume of 3.96 Billion USD.
This Week Ahead
Ripple will need to retain its levels above $1.0500 this week, after which a bullish trend could be seen later in the coming days. Today in the Asian trading session, the price of XRPUSD touched an intraday high of 1.1377 after which a continuous selling pressure could be observed. At the current market levels of 1.0962, we can see some market consolidation towards the 1.0900 levels after which further decline is expected.
If the price of Ripple continues to remain well supported above the $1.0500 handle, we will see a progression of bullish trend formation in the closing of this week.
Technical Indicators:
Relative strength index (14-day): at 41.070 indicating a SELL
Moving averages convergence divergence(14-day): at -0.016 indicating a SELL
Bull/Bear power (13-day): at -0.0171 indicating a SELL
Average direction change (14-day): at 49.775 indicating a SELL
FXOpen offers the world's most popular cryptocurrency CFDs*, including Bitcoin and Ethereum. Floating spreads, 1:2 leverage — at your service (additional fees may apply). Open your trading account now or learn more about crypto CFD trading with FXOpen.
*Important: At FXOpen UK, Cryptocurrency trading via CFDs is only available to our Professional clients. They are not available for trading by Retail clients. To find out more information about how this may affect you, please get in touch with our team.
This article represents the opinion of the Companies operating under the FXOpen brand only. It is not to be construed as an offer, solicitation, or recommendation with respect to products and services provided by the Companies operating under the FXOpen brand, nor is it to be considered financial advice.
Stay ahead of the market!
Subscribe now to our mailing list and receive the latest market news and insights delivered directly to your inbox.


Latest articles

AUD/USD: Will the RBA Be Able to Keep Its Currency Strong?
As the chart shows, AUD/USD has entered a distinctly bearish phase in recent weeks, reflecting the broader consolidation — and in some cases outright weakness — that the US dollar has begun imposing across most major currency pairs.
Fundamental Analysis
The

AUD/CAD: Pair Remains Range-Bound Amid Interest Rate Divergence
The key macroeconomic factor for AUD/CAD remains the divergence in monetary policy between the two central banks. After three consecutive rate hikes since the beginning of the year, the Reserve Bank of Australia left its cash rate unchanged at

Brent Crude Oil Analysis: Stabilisation or Simply a Pause?
Over the past few weeks, financial markets have been more focused than ever on developments surrounding the Strait of Hormuz — a critical waterway at the centre of ongoing US-Iran negotiations. The back-and-forth of diplomatic headlines has injected significant volatility into