


BTCUSD and XRPUSD Technical Analysis – 28th DEC, 2021
FXOpen
BTCUSD: Double Top Pattern Below $52,000
Bitcoin was unable to sustain its bullish moves this week. After touching a high of $52,008, it declined to a low of 48740 in the Asian trading session today.
At present, the markets are ranging in a consolidation phase below the $50,000 handle, and we may see more downward pressure in the coming days.
Bitcoin has gone back into a bearish channel and is trading below the $50,000 handle. We can see more downsides in the range of $49,000 to $48,500 later today.
We can clearly see a double top pattern below the $52,000 level, which signifies the end of an uptrend and a shift towards a downtrend.
Both the Stoch and Williams percent ranges are indicating an OVERBOUGHT level, meaning that in the immediate short-term a decline in the prices is expected.
Bitcoin is now moving below its 100 hourly simple and exponential moving averages.
The average true range is indicating a high market volatility which means that markets are due to decline further.
- bitcoin trend reversal is seen below $52,000
- Ultimate oscillator is indicating a NEUTRAL level
- The price is now trading just above its pivot level of $49,227
- All the moving averages are giving a STRONG SELL signal at the current market level of $49,370
Bitcoin: Bearish Reversal Below $52,000 Confirmed

Bitcoin is forming a bearish trend pattern which means that the prices can start declining further due to the selling pressure that is coming into global cryptocurrency markets.
All of the major technical indicators are giving a STRONG SELL signal, which means that in the immediate short-term we are expecting targets of $49,000 and $48,000.
The price of BTCUSD is now facing its classic support level of $49,077 and Fibonacci support level of $49,111 after which the path towards $48,500 will get cleared.
In the last 24hrs, BTCUSD has gone DOWN by -2.83% with a price change of 1436$, and has a 24hr trading volume of USD 30.797 billion. We can see an Increase of 49.60% in the trading volume as compared to yesterday.
This increase in the trading volume of BTC is happening because of the increased selling pressure which, in turn, has been triggered by the end-of-the-year market liquidation and profit taking by global investors.
The Week Ahead
Bitcoin has now started its downside correction as the bears managed to bring its price below the important psychological support level of $50,000.
The short-term outlook is negative, but the medium to long-term outlooks remain BULLISH for bitcoin, with targets of $55,000 to $60,000 in 2022.
The relative strength index is below the 35 mark indicating a weaker demand for bitcoin and a heavy selling pressure in the BTCUSD market.
We can expect to see the level of $48,500 before the end of 2021.
BTC Options Market
As 2021 comes to an end, bitcoin is facing a huge options expiration on 31st Dec 2021.
Around 5.7 billion USD worth of BTC options will expire on the Deribit exchange, which will increase the liquidity in the bitcoin markets globally.
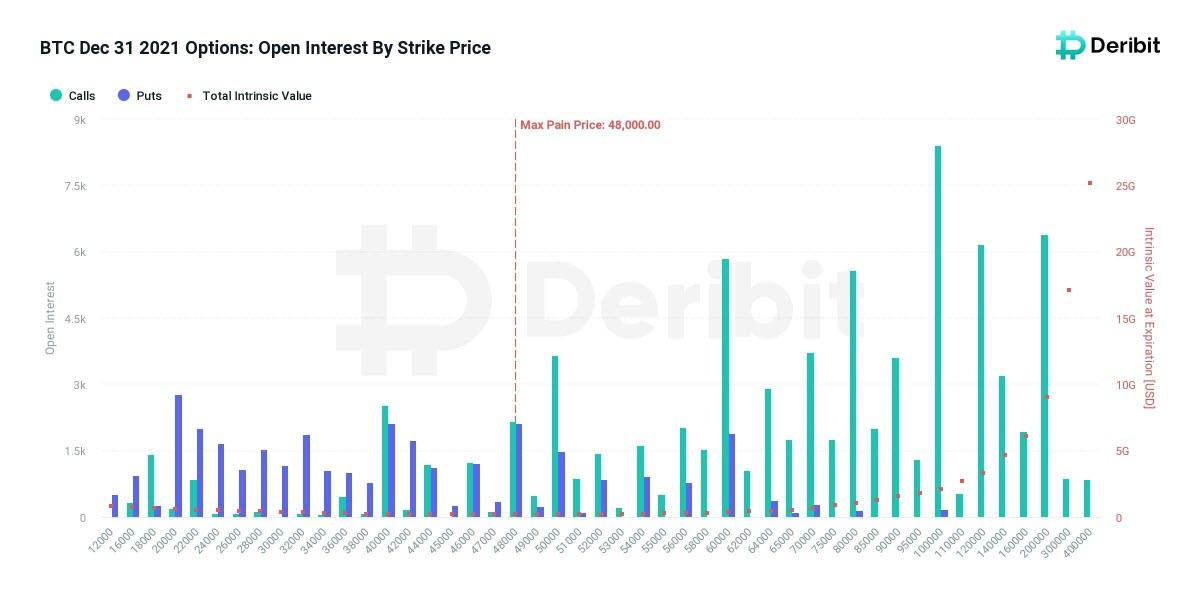
The total combined value of bitcoin options will be valued at 10.7 billion USD.
Technical Indicators:
Relative strength index (14-day): at 32.33 indicating a SELL
Average directional change (14-day): at 46.25 indicating a SELL
Rate of price change: at -4.503 indicating a SELL
Moving averages convergence divergence (12,26): at -411.70 indicating a SELL
XRPUSD – Double Top Pattern Below 1.0165
In today’s Asian trading session, Ripple was unable to sustain its bullish momentum against the US dollar, and after touching a High of 0.9553 yesterday, started its decline touching a low of 0.8693.
At present, the prices of Ripple are ranging into a consolidation phase below the 0.9000 levels, and a further decline is expected in the coming days.
We can clearly see a double top pattern below 1.0165 which signifies the end of an uptrend and a shift towards a downtrend.
The short-term outlook for Ripple has turned bearish; the medium-term outlook remains bullish; the long-term outlook is strongly bullish.
Ripple is now trading just above its pivot level of 0.8883; it is facing its classic support level of 0.8776 and Fibonacci resistance level of 0.8854 in the European trading session.
- All technical indicators are giving a STRONG SELL signal
- Ripple has entered into a bearish channel below 1.0100
- All the moving averages are giving a STRONG SELL signal
- Average true range indicates a HIGH market volatility
Ripple: Bearish Channel Below 1.0100 Confirmed

Ripple is now moving into a consolidation channel below the 0.9000 level, and we can see more selling pressure which will bring down the prices of XRPUSD to the level of 0.8500.
Market volatility is HIGH today due to the end-of-the-year selling and market liquidation by long-term Ripple investors.
The price of XRPUSD has gone DOWN by 2.99% with a price change of $-0.02748 in the past 24hrs, and has a trading volume of 2.363 billion USD.
We can see a 71.01% increase in the trading volume of Ripple in the last 24 hours. This increase is due to the heavy selling pressure by the global investors who are looking to exit their Ripple holdings before the end of 2021.
This Week Ahead
Ripple price is in the consolidation level below the 0.9000 handle in the European trading session.
The relative strength index is valued at 34 which indicates a weaker demand for Ripple and more selling is expected before the end of 2021. We are now looking at 0.8500 before the end of 2021.
This is also a time when long-term investors can enter into a buying opportunity with a time frame of 6 months.
XRP Performance in 2022
In the beginning of 2021 we saw XRP prices in the range of 0.2374 which was due to the ongoing US SEC lawsuit against Ripple Labs. At the present market conditions, many analysts are favoring the outcome in favor of Ripple Labs.
With the present market valuation at 0.8900, we are looking for an appreciation of more than 90% in 2022 with a favorable outcome.
Technical Indicators:
Moving averages convergence divergence (12,26): at -0.010 indicating a SELL
Average directional change (14-day): at 37.18 indicating SELL
Relative strength index (14-day): at 34.47 indicating a SELLRate of price change: at -5.052 indicating a SELL
FXOpen offers the world's most popular cryptocurrency CFDs*, including Bitcoin and Ethereum. Floating spreads, 1:2 leverage — at your service (additional fees may apply). Open your trading account now or learn more about crypto CFD trading with FXOpen.
*Important: At FXOpen UK, Cryptocurrency trading via CFDs is only available to our Professional clients. They are not available for trading by Retail clients. To find out more information about how this may affect you, please get in touch with our team.
This article represents the opinion of the Companies operating under the FXOpen brand only. It is not to be construed as an offer, solicitation, or recommendation with respect to products and services provided by the Companies operating under the FXOpen brand, nor is it to be considered financial advice.
Stay ahead of the market!
Subscribe now to our mailing list and receive the latest market news and insights delivered directly to your inbox.


Latest articles

Pound at Key Levels: Markets Assess Impact of Political Uncertainty in the UK
The British pound remains under pressure following increased political uncertainty in the United Kingdom triggered by the Prime Minister’s resignation. Investors are assessing potential shifts in the political and economic policy outlook after the head of government stepped down,

Silver: Fed Tightens Its Tone as Price Returns to the Volume Profile Zone
Silver came under pressure following the Federal Reserve’s June meeting, at which policymakers kept interest rates unchanged at 3.50–3.75%. Nine of the 18 committee members still see the possibility of a rate increase this year, reinforcing

Ethereum: Market Assesses the Strength of the Corrective Recovery
Following a period of heightened volatility in early June, investor attention in Ethereum has once again shifted towards institutional demand and the development of the spot ETF market in the United States. The funds launched last year continue to serve