


Capitalising on Market Volatility
FXOpen
Market volatility, characterised by rapid price fluctuations, presents both opportunities and challenges for traders. Understanding its causes, measuring it effectively, and employing strategies to capitalise on it can lead to better trading results. This article explores the essentials of market volatility, from its definition and measurement to strategies like breakout and swing trading.
Definition and Causes of Market Volatility
When discussing volatility and its meaning in finance, it’s typically defined as the degree of variation in a trading price series over a certain period. It is an essential aspect of the financial markets that signifies the fluctuation in the price of an asset or market index. High volatility means that the price of the asset is moving significantly over a short time, while low volatility indicates smaller price changes.
Causes of Volatility
There are many causes for volatile markets, such as:
- Economic Indicators: Economic data such as GDP growth, employment rates, and inflation can lead to volatility. For instance, unexpected changes in interest rates by central banks may result in immediate price swings.
- Geopolitical Events: Political instability, elections, or changes in government policies can cause uncertainty and, thus, volatility. An example would be the sharp market reaction to the Brexit vote in 2016.
- Market Sentiment: Trader emotions and reactions to news and events often lead to rapid buying or selling, driving volatility. A sudden surge in buying after positive earnings reports is a typical example.
- Liquidity Constraints: In markets with limited liquidity, even small trades can cause significant price movements, leading to increased volatility.
- Global Events and Crises: Natural disasters, pandemics, or financial crises can create substantial uncertainty, leading to increased market volatility. The COVID-19 pandemic's effect on global markets throughout 2020 is a case in point.
- Technological Factors: Algorithmic trading and high-frequency trading can create rapid price movements and fluctuations within seconds, adding to stock market volatility.
The Volatility Index
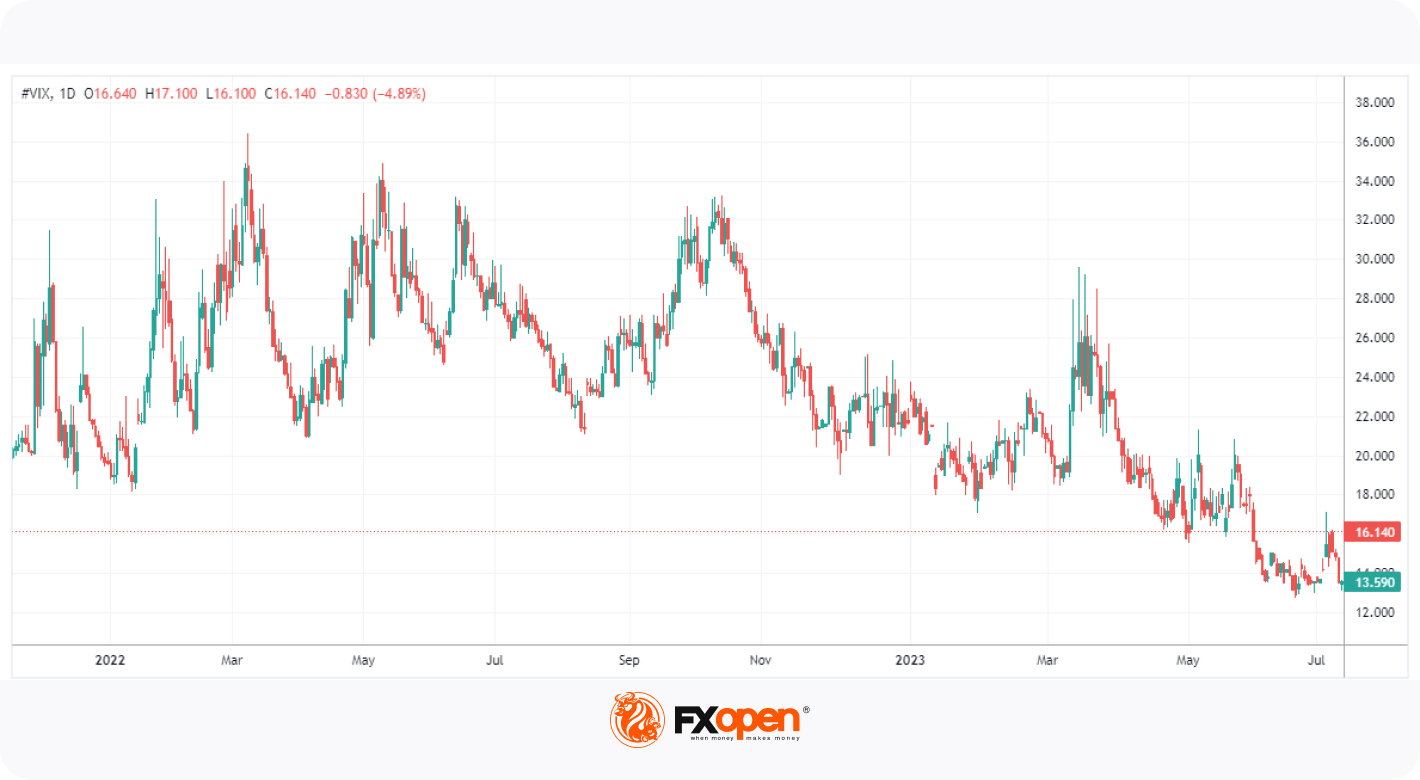
The Volatility Index, often referred to as the VIX, acts as a thermometer for market uncertainty and investor sentiment. Developed by the Chicago Board Options Exchange (CBOE), the VIX quantifies market risk and investor fear by measuring the expected volatility of the S&P 500 Index. A higher VIX value typically represents a higher level of fear or uncertainty, while a lower VIX reflects confidence and stability.
If you’d like to explore the VIX for yourself, log on to FXOpen’s free TickTrader platform and simply search for VIX.
How Is Volatility Measured?
Volatility can be gauged in a number of ways, in more ways than just with the VIX. Here are a few:
- Historical Volatility: This measures past fluctuations by analysing the standard deviation or variance of an asset's price over a specified time frame. It's a useful tool for understanding past behaviour but doesn't predict future volatility.
- Implied Volatility: Unlike historical volatility, implied volatility looks forward, reflecting market participants' expectations. It's often derived from the pricing of options and can be used to gauge the anticipated fluctuations in an asset's price.
- Average True Range (ATR): ATR is a technical indicator used to measure market volatility by looking at the range of price movement over a set period. It takes into account the highs and lows and provides an average, offering insights into the ongoing market dynamics.
- Using Volatility Indices like VIX: Beyond the popular VIX, other volatility indices tailored to specific markets or regions can provide insights into market fear and confidence. These indices are often derived from the implied volatility of various options.
- Bollinger Bands: A technical analysis tool that uses standard deviation along with moving averages to measure volatility. The widening or narrowing of the bands indicates an increase or decrease in volatility, respectively.
Strategies for Capitalising on Market Volatility
So, how do traders actually capitalise on volatile markets?
Breakout Trading
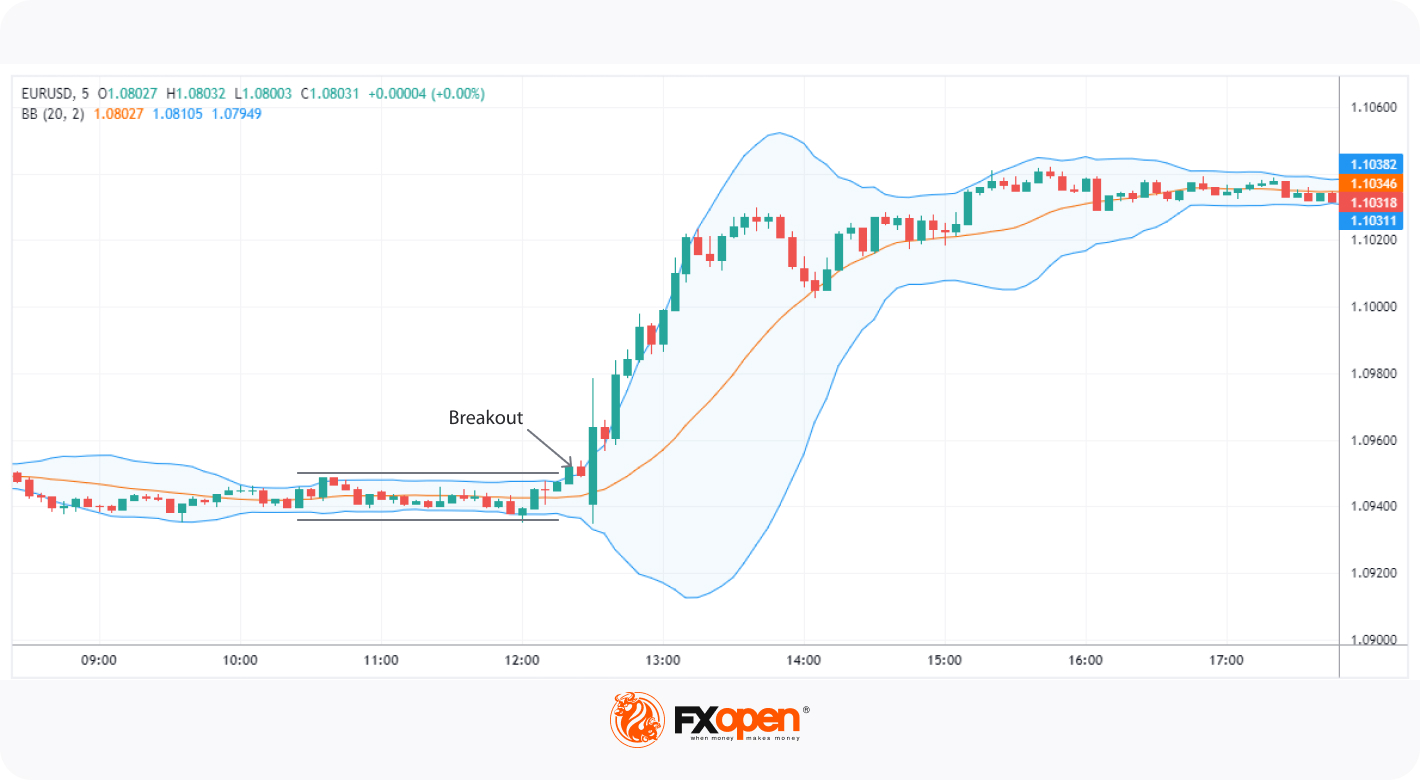
Breakout trading is a strategy employed by traders to identify and take advantage of significant price movements. A breakout occurs when an asset's price moves outside a defined support or resistance level with increased volume.
- Identifying Breakout Levels: Traders often look for price patterns like rectangles, triangles, or other formations. The boundaries of these patterns create the support and resistance levels. A breakout is said to occur when the price moves beyond these levels.
- Using Bollinger Bands: When the price approaches or moves outside these bands, it may signal a breakout, especially when coupled with increased volume. This makes Bollinger Bands a valuable indicator for gauging market volatility and potential breakouts.
- Volume Consideration: A true breakout is usually accompanied by a noticeable increase in trading volume. This increased volume signifies stronger investor interest, supporting the price movement's sustainability.
- Entry and Exit Points: In breakout trading, deciding the right entry and exit points is crucial. Traders often set entry points slightly above resistance or below support to confirm the breakout.
- Risk Management: Breakout trading can be volatile, and the strategy must be complemented with sound risk management, including position sizing and setting appropriate stop-loss levels. Stop-loss orders are usually placed near the entry point to limit potential losses.
Swing Trading
Swing trading is a strategy that aims to capture gains in an asset over a short to medium-term period, usually a few days to several weeks. It leverages the natural "swing" in the price cycles, often capitalising on market volatility. Here's how it's typically executed:
- Identifying Trends: Swing traders often begin by recognising the prevailing trend of an asset, whether upward, downward, or sideways. Identifying the trend helps in aligning trades with the market's general direction.
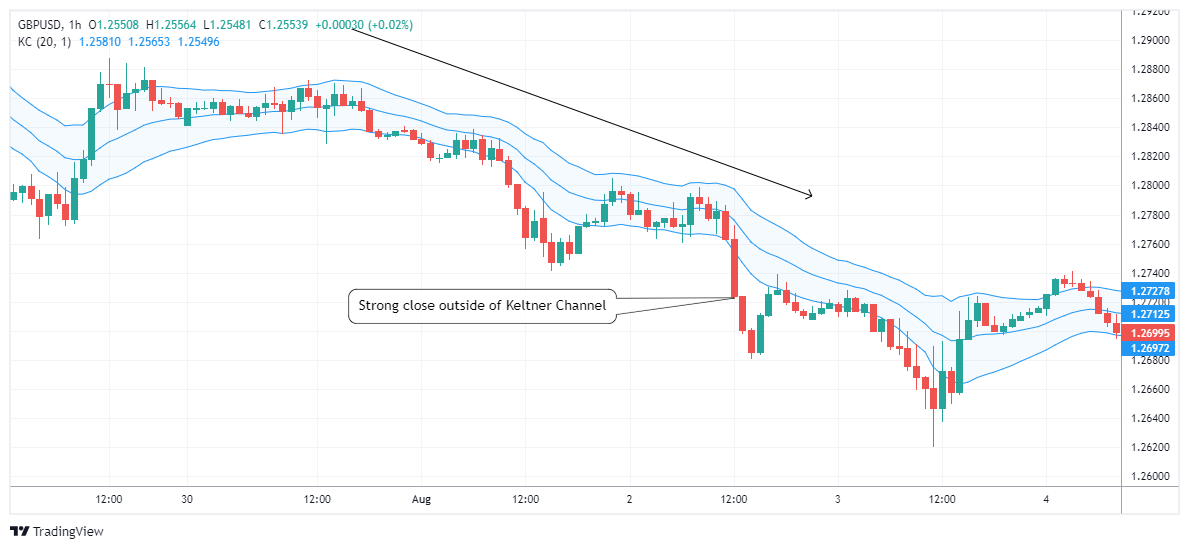
- Using Technical Indicators for Volatility: In addition to tools like moving averages, Relative Strength Index (RSI), or Stochastic Oscillator, swing traders often utilise volatility indicators such as Bollinger Bands and Keltner Channels. Keltner Channels, comprising a moving average and bands created using the Average True Range (ATR), are particularly useful in gauging market volatility and identifying potential entry and exit points when price moves beyond the Channel.
- Entry and Exit Points: Determining precise entry and exit points is vital. Swing traders often enter a position after a trend correction has occurred and exit when a predetermined profit level is reached or a trend reversal is signalled. Volatility measurements, such as Keltner Channels, can assist in fine-tuning these decisions.
- Risk Management: Effective risk management techniques, including setting stop-loss orders and position sizing, are integral to successful swing trading. They help control potential losses if the market moves against the trader's expectations, particularly during volatile market conditions.
Additional Considerations and Risks
While these two strategies provide a great starting point for trading volatile markets, there are a few considerations to be aware of:
- Market Reversals: Sudden reversals can lead to losses, particularly in highly volatile markets.
- False Signals: Incorrectly identifying a breakout or swing might result in entering or exiting a trade prematurely.
- Leverage Risks: Utilising leverage can amplify both gains and losses, requiring careful management.
- Emotional Decision-Making: Trading in volatile markets requires discipline; emotional decisions can lead to significant losses.
- Economic Events: Unexpected economic announcements or global events can dramatically change market conditions, impacting trades.
The Bottom Line
Capitalising on market volatility can be a complex yet rewarding endeavour. By understanding volatility, employing strategies like breakout and swing trading, and being mindful of associated risks, traders may navigate turbulent markets with confidence. To explore these techniques in live markets, consider opening an FXOpen account. You’ll gain access to hundreds of markets and a wide range of tools and resources to help you along your journey. Happy trading!
This article represents the opinion of the Companies operating under the FXOpen brand only. It is not to be construed as an offer, solicitation, or recommendation with respect to products and services provided by the Companies operating under the FXOpen brand, nor is it to be considered financial advice.
Stay ahead of the market!
Subscribe now to our mailing list and receive the latest market news and insights delivered directly to your inbox.


Latest articles

Nasdaq 100: 48 Hours of Chaos, One Trendline Standing in the Way
Wall Street just lived through one of its wildest 48 hours of the year. On Wednesday, the Fed held rates steady at 3.50%-3.75%, but three FOMC members broke ranks to demand a hike—an unusually hawkish dissent

Amazon Analysis: Strong Earnings Coincide with a Breakout from the Correction
On 30 July, Amazon.com reported its financial results for the second quarter of 2026, significantly exceeding market expectations. Revenue rose 20% year-on-year to $200.6 billion, compared with the consensus forecast of around $196.5 billion. The main growth

GBP/USD and EUR/GBP Await Key Bank of England Decision
The pound strengthened following the outcome of the US Federal Reserve meeting, where the central bank, as expected, kept interest rates unchanged. However, the Fed did not provide the market with clear signals of an imminent shift towards rate cuts,