


Dash Continues Downtrend, Ether in Range
FXOpen

It’s a mixed bag for the two crypto-currencies we cover on Thursdays. While Dash is continuing the downtrend started last week, Ether is range-bound.
Ether in a Range
Ether prices failed to break above the 0.09322 swing high last week. A break of this level could kick-start a new rally. But after peaking out at 0.093 ETH/BTC saw continued losses every single day. We are now up to seven red (or black) candles in a row.
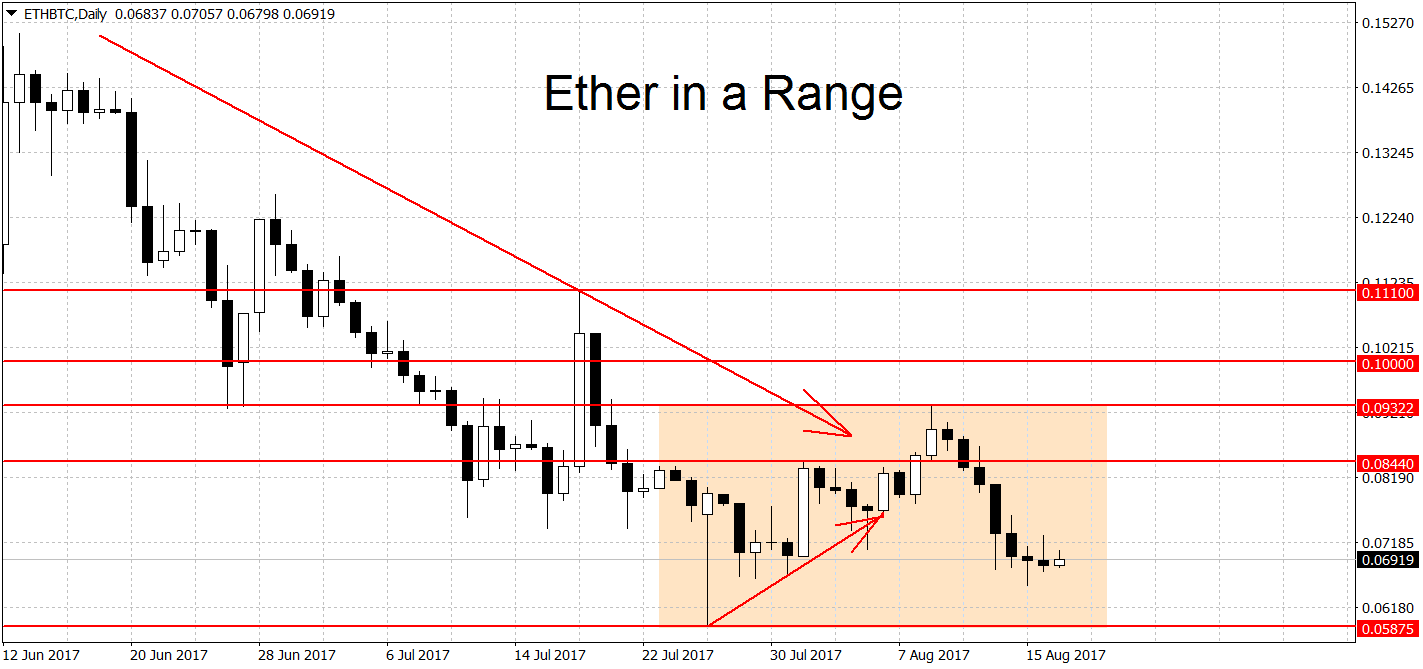
Despite the losses however prices are still short of starting a new downtrend. For that, we needed a break below the 0.05875 swing low. Until either of these levels is decisively broken, ETH will remain in a range on the daily charts. On the longer-term weekly charts, ETH/BTC is range-bound as well. Prices are staying in a bullish trend on the monthlies.
Dash Continues Downtrend
Dash is continuing the downtrend that began last week with the break below the important 0.06 support level. We are currently quoted at 0.055 Dash per BTC, down by 6.1 percent since our last update.
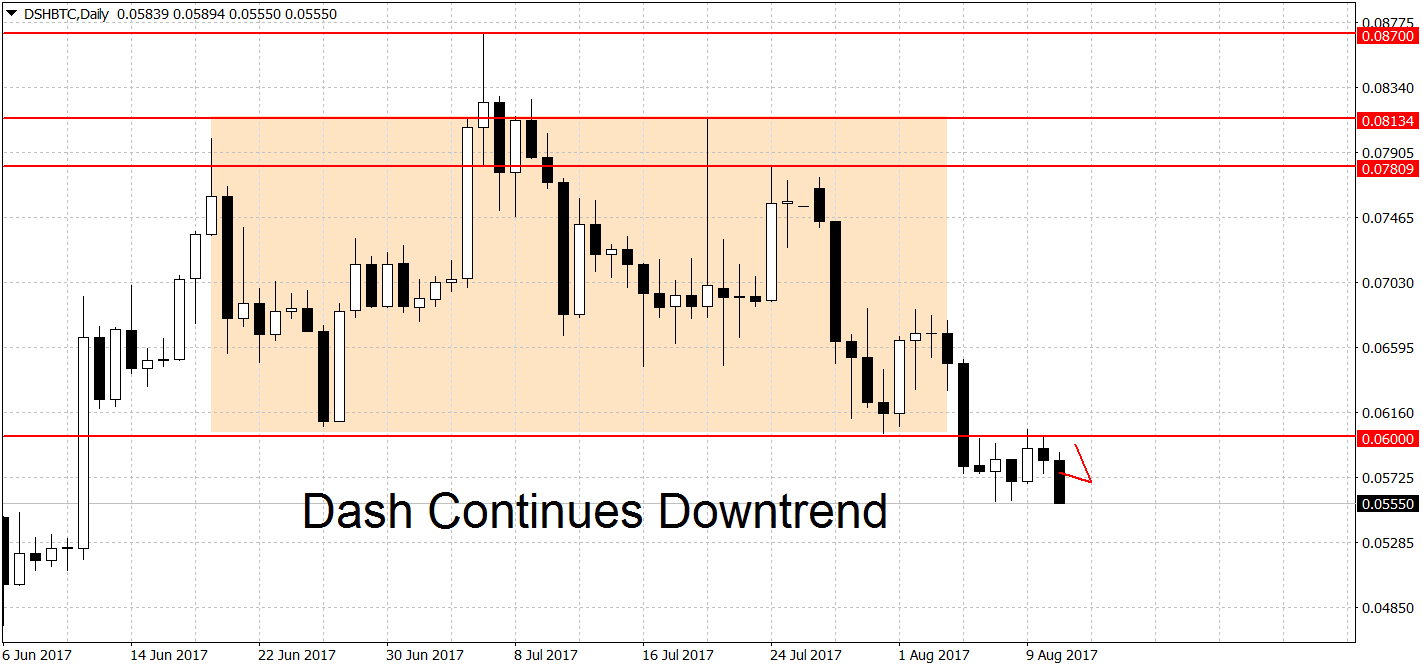
The trend lower will remain in force until we get a breakout above the 0.06858 swing high. A new uptrend requires a move beyond the 0.08 BTC level.
On the lower end, we have support at the 0.05 round figure. This is followed by a strong support area consisting of several previous swing lows at 0.04728, 0.046, 0.0448 and 0.04303 BTC. A clearing of this area with a move below 0.043 could exacerbate the losses for Dash. On the longer-term charts, DSH/BTC remains in a bullish trend.
Bitcoin Rally Continues
Part of the reason why we’re seeing continued losses in XXX/BTC pairs like ETH/BTC and DSH/BTC is the recent strong performance of bitcoin. The crypto is up by over 140% since the $1,810 lows one month ago. Big brother is trading at $4,425 right now, up by 8.6 percent from two days ago.
The main driver behind the gains is the signalling/activation of Segwit. More on the technical details about Segwit2x HERE. According to recent estimates, the activation of the upgrade is expected around 23:55 on August 22nd. Prices should remain well supported until we get closer to the event when ‘sell the news’ mentality may take over.
The bears need a break below the $3,230 swing low to end the current bull trend. But a new bearish trend will not commence until prices fall below the $2,500 level as well. On the weekly and monthly charts BTC/USD is in rally mode as well.
Cryptocurrencies trading with FXOpen broker.
FXOpen offers the world's most popular cryptocurrency CFDs*, including Bitcoin and Ethereum. Floating spreads, 1:2 leverage — at your service (additional fees may apply). Open your trading account now or learn more about crypto CFD trading with FXOpen.
*Important: At FXOpen UK, Cryptocurrency trading via CFDs is only available to our Professional clients. They are not available for trading by Retail clients. To find out more information about how this may affect you, please get in touch with our team.
This article represents the opinion of the Companies operating under the FXOpen brand only. It is not to be construed as an offer, solicitation, or recommendation with respect to products and services provided by the Companies operating under the FXOpen brand, nor is it to be considered financial advice.
Stay ahead of the market!
Subscribe now to our mailing list and receive the latest market news and insights delivered directly to your inbox.


Latest articles

Weekly Market Insights with Gary Thomson: US Inflation, UK GDP, and US-China Meeting
In this video, we’ll explore the key economic events and market trends, shaping the financial landscape. Get ready for insights into financial markets to help you navigate the week ahead. Let’s dive in!
In this episode of Market

Silver: Structural Deficit Amid Declining Demand
Fundamental Background
The structural deficit in the silver market has now persisted for a sixth consecutive year. According to forecasts by the Silver Institute, the gap between supply and demand in 2026 is expected to reach 67 million ounces, forcing

EUR/USD — At the Crossroads of Monetary Expectations
Fundamental Background
The fundamental backdrop for EUR/USD in early May is shaped by diverging monetary policy expectations on both sides of the Atlantic. At its 30 April meeting, the ECB left interest rates unchanged; however, Governing Council members Joachim