


FXOpen
Dash is down by 3 percent since last Thursday. Ether on the other hand is up but by only 1%, from 0.07772 to 0.07854 BTC.
Ether Still in Range
The low volatility across the crypto markets continues. Ether is up by only 1 percent compared to one week ago. Consequently no trends have been established on the daily chart. For that to happen price has to breakout outside of the rectangle on the chart below.
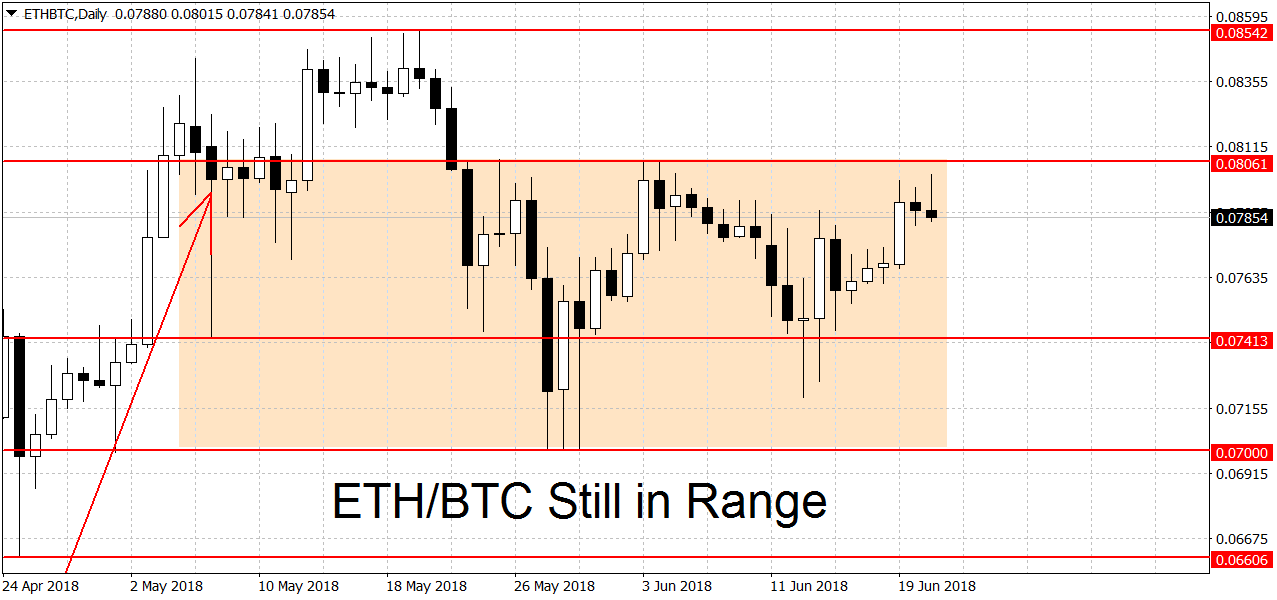
A move above the 0.08061 BTC swing high could start a new rally. Higher up there’s resistance at 0.08542 BTC followed by the 0.08829 swing high. Higher still we have the 0.09 and 0.1 BTC round figures as potential resistance levels. A decisive breakout above here may open to door to this year’s high at 0.121 BTC.
On the lower end we need a breakdown below 0.07 BTC to start a new bearish trend on the daily charts. Support below here can be found at 0.06606 BTC followed by the former swing high at 0.05906 BTC. On the weekly charts ETH/BTC is also range-bound. The monthly charts are still keeping the bullish bias.
Dash Down 3 Percent
Unlike ETH/BTC, Dash is trading lower this week. Yesterday we hit a new 2018 low at 0.03782 BTC but prices quickly bounced back. We are quoted at 0.03897 BTC at the moment, down from 0.04039 BTC last Thursday or – 3.6% in percentage terms.
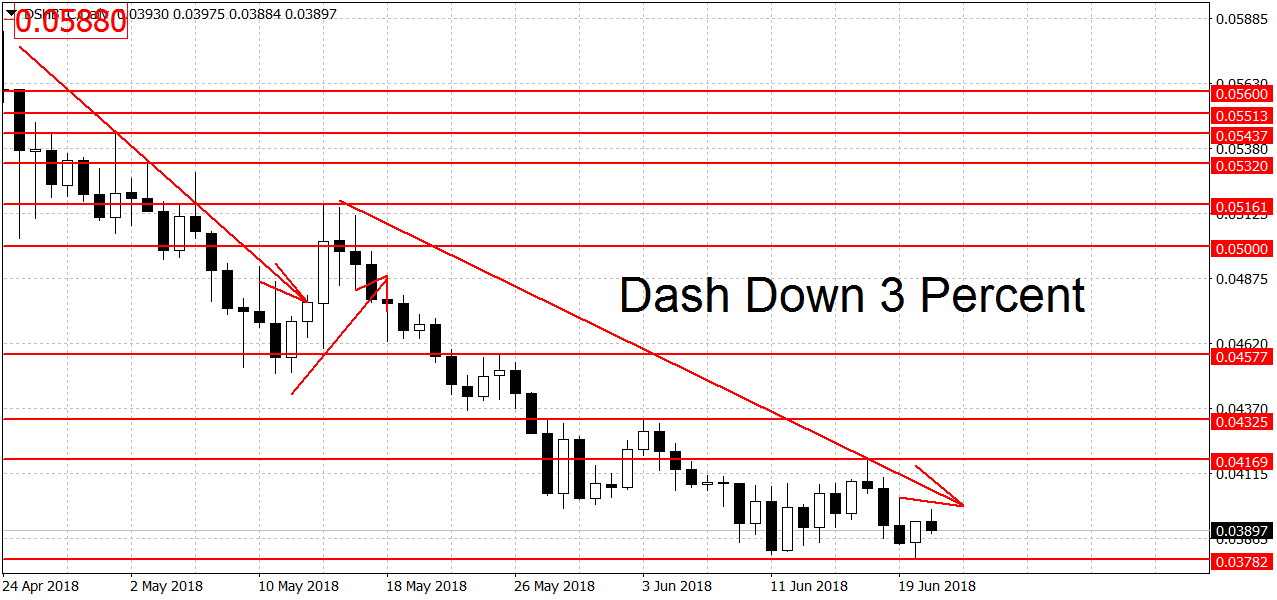
The downtrend for DSH/BTC is still in play. A breakout above 0.04169 BTC is needed to end it. A move beyond 0.04325 BTC could start a new rally. On the lower end there’s weak support at 0.03782 BTC followed by 0.03557 BTC and 0.03452 BTC. The latter level is also a 14-month low for Dash. A breakdown below it could exacerbate the losses. On the longer-term charts Dash is bearish on the weeklies but bullish on the monthly charts.
Bitcoin Little Changed
Similarly to the two altcoins above, BTC/USD is trading little changed since our last update on Tuesday. We are quoted at $6,729 dollars right now, up by $29 or 0.4 percent.
A decisive breakout above $7,046 dollars could end the current downtrend. A move beyond $7,775 dollars is needed to restart the rally in prices.
FXOpen offers the world's most popular cryptocurrency CFDs*, including Bitcoin and Ethereum. Floating spreads, 1:2 leverage — at your service (additional fees may apply). Open your trading account now or learn more about crypto CFD trading with FXOpen.
*Important: At FXOpen UK, Cryptocurrency trading via CFDs is only available to our Professional clients. They are not available for trading by Retail clients. To find out more information about how this may affect you, please get in touch with our team.
This article represents the opinion of the Companies operating under the FXOpen brand only. It is not to be construed as an offer, solicitation, or recommendation with respect to products and services provided by the Companies operating under the FXOpen brand, nor is it to be considered financial advice.
Stay ahead of the market!
Subscribe now to our mailing list and receive the latest market news and insights delivered directly to your inbox.


Latest articles

Consolidation Ahead of NFP: Commodity Currencies Search for Direction
Commodity-linked currencies have entered a consolidation phase following recent directional moves, as market participants adopt a wait-and-see approach ahead of key US labour market data. Current price action reflects a balance between ongoing demand for the US dollar and attempts

The Real Driver Behind the Dollar Rally: Market Insights with Gary Thomson
The US dollar has been firm, but the drivers behind the move may be more complex than they first appear.
While geopolitical tension and shifts in risk sentiment play a role, current price behaviour seems increasingly influenced by inflation expectations

EUR/USD and USD/CHF Pull Back: Market Reacts to Fundamentals
European currencies have shown a recovery in recent trading sessions after their recent decline, displaying early signs of a reversal. The US dollar is weakening amid expectations surrounding upcoming US macroeconomic data, while market participants are reassessing their short-term positions