


Dash Surges by 110 Percent
FXOpen
Dash continues the strong rally after the breakout two weeks ago. Earlier this month a high of 0.04825 was reached. We’re trading near these highs at 0.04243 BTC right now. Ether is on the move as well, after commencing its down uptrend.
Dash Nears All-Time High
Dash prices are nearing the all-time high set earlier this month. Since our last update, the altcoin surged from 0.01969 to 0.04243. In percentage terms, this is a gain of close to 110%.
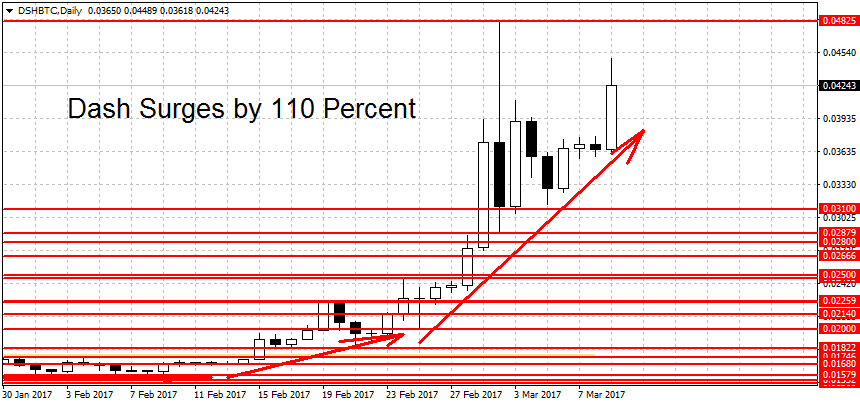
The trend remains up but latecomers to the party may have a hard time finding good entries. Look at the chart above. After hitting a high of 0.04825 on March 2nd Dash to a low of 0.2879 on the same day. This is a drawdown of over 40 percent if you were unfortunate to long the exact top. While longs are still favored, due to the elevated volatility bulls should use large stops to have hope in surviving the swings. This, in turn, means that the size per trade will be much lower and the risk to reward will be much worse than it was in the 0.015 – 0.02 area.
A breakdown below 0.0235 BTC is needed to end the current rally. Several untested support levels can be found below the current price, starting with the 0.02879 swing low and 0.02478. The major resistance at 0.0175 should now act as support. The round figures at 0.03, 0.025 and 0.02 are also worth noting as potential turning points or take profit areas. All three trends for DASH (short-term, medium-term and long-term) are pointing upward.
Ether Back in Rally Mode
It took one failed attempt but ETH/BTC in back on the offensive. We’re now trading over 30 percent higher compared to two weeks ago.
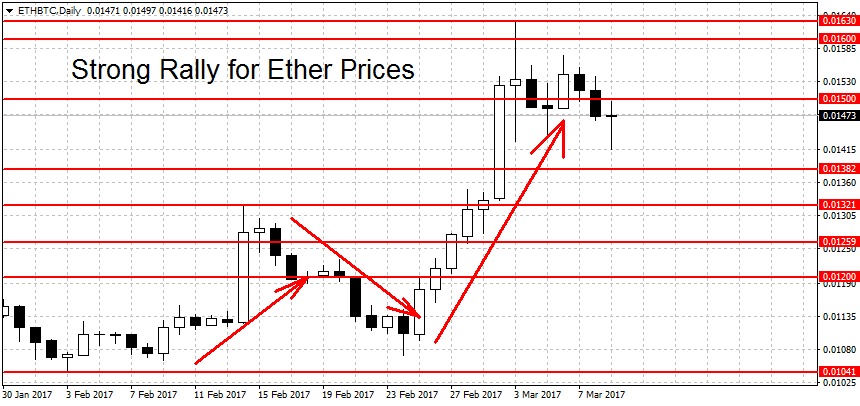
As you can see probably deduce from the chart above, we’re now back in bullish territory. Weak resistance can be found at the 0.015 level, closely followed by this month’s high at 0.0163 BTC per coin.
On the lower end, a breakdown below 0.012 is needed to end the current uptrend. Slightly above here we have 0.01321, the high reached during the failed breakout three weeks ago. This is likely to be a strong support to falling prices.
Note that the SEC decision on the bitcoin ETF is still not announced. Both of the pairs covered here have a BTC component (DSH/BTC and ETH/BTC). Because of this major volatility is possible in the next 30 hours until Friday’s ‘close’ so caution is advised.
FXOpen offers the world's most popular cryptocurrency CFDs*, including Bitcoin and Ethereum. Floating spreads, 1:2 leverage — at your service (additional fees may apply). Open your trading account now or learn more about crypto CFD trading with FXOpen.
*Important: At FXOpen UK, Cryptocurrency trading via CFDs is only available to our Professional clients. They are not available for trading by Retail clients. To find out more information about how this may affect you, please get in touch with our team.
This article represents the opinion of the Companies operating under the FXOpen brand only. It is not to be construed as an offer, solicitation, or recommendation with respect to products and services provided by the Companies operating under the FXOpen brand, nor is it to be considered financial advice.
Stay ahead of the market!
Subscribe now to our mailing list and receive the latest market news and insights delivered directly to your inbox.


Latest articles

US Dollar Strengthens Amid Equity Market Weakness and Hawkish Fed Rhetoric
The US dollar continues to hold firm near multi-year highs as sentiment across equity markets deteriorates and investors increasingly expect the Federal Reserve to maintain a restrictive monetary policy stance for longer. The US economy remains resilient, while inflation risks

Bitcoin: Corrective Channel Broken as Traders Turn More Active
Bitcoin has come under the influence of several factors simultaneously. The wave of selling at the beginning of June was linked to Strategy's first disclosed Bitcoin sale in several years, a prolonged series of outflows from spot ETFs, and a

DAX 40: consolidation amid technology sell-off
A wave of selling in the technology sector that emerged earlier this week has weighed on European equities. The trigger was investor concern over the profitability of large-scale debt-funded investments by major US tech companies in AI infrastructure. The Nasdaq